Web UI – JDisc Diagrams – A new way to visualize discovery data
Dear JDisc friends,
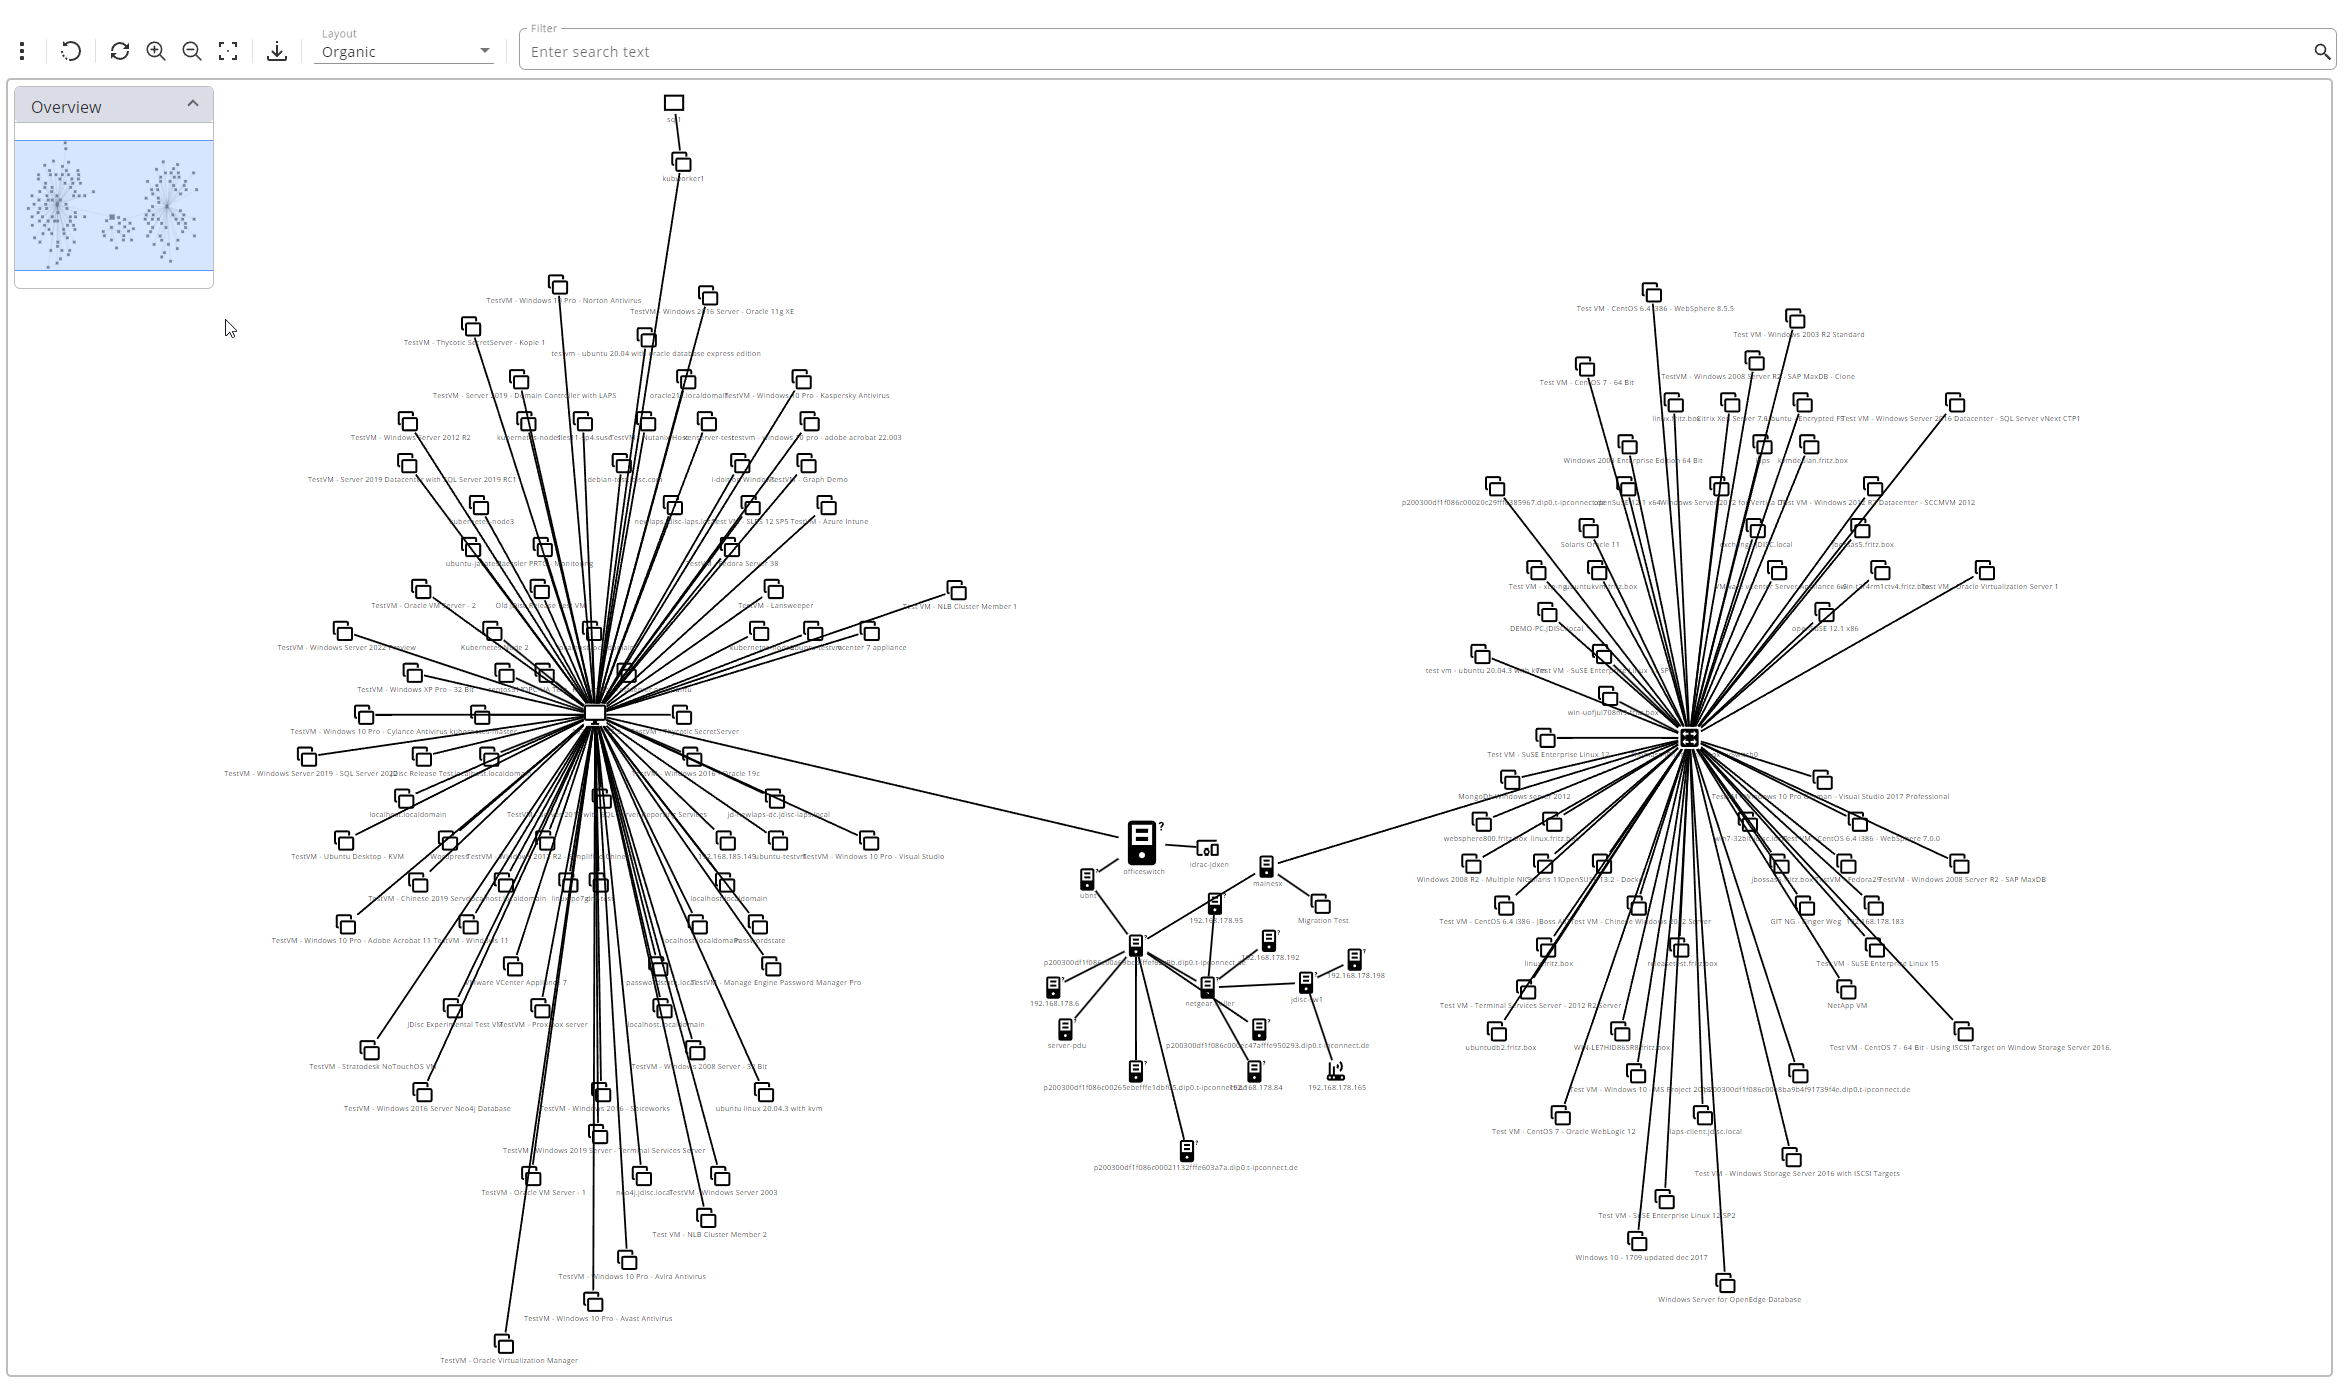
with JDisc Discovery release 5199, we have introduced a new set of features in our Web UI to support diagrams. In addition to the classic built-in reports, the diagrams offer a new way to view and navigate JDisc Discovery data.
The main building blocks of JDisc diagrams are the entities. Such entities can be the main data “objects”, such as devices, applications, networks, clusters, etc. These entities form the nodes of a diagram. The nodes of a diagram can be connected. For instance:
- a device can be connected to other devices.
- a network can contain a set of devices.
- a device can have an operating system where applications are installed.
- etc.
Here is a short video introduction to the new features.
The Entity Diagram
The simplest form of a JDisc diagram is the single entity diagram. You can access such a diagram from the context menu of a diagram supporting report. This report has a diagram context menu with three different types of diagrams:
- The “Device Diagram” which is an Entity Diagram with a device entity node as the base
- The “Network Topology Diagram” which opens the network topology of the selected device
- The “Virtualization Topology Diagram” which opens the virtualization topology of the selected device
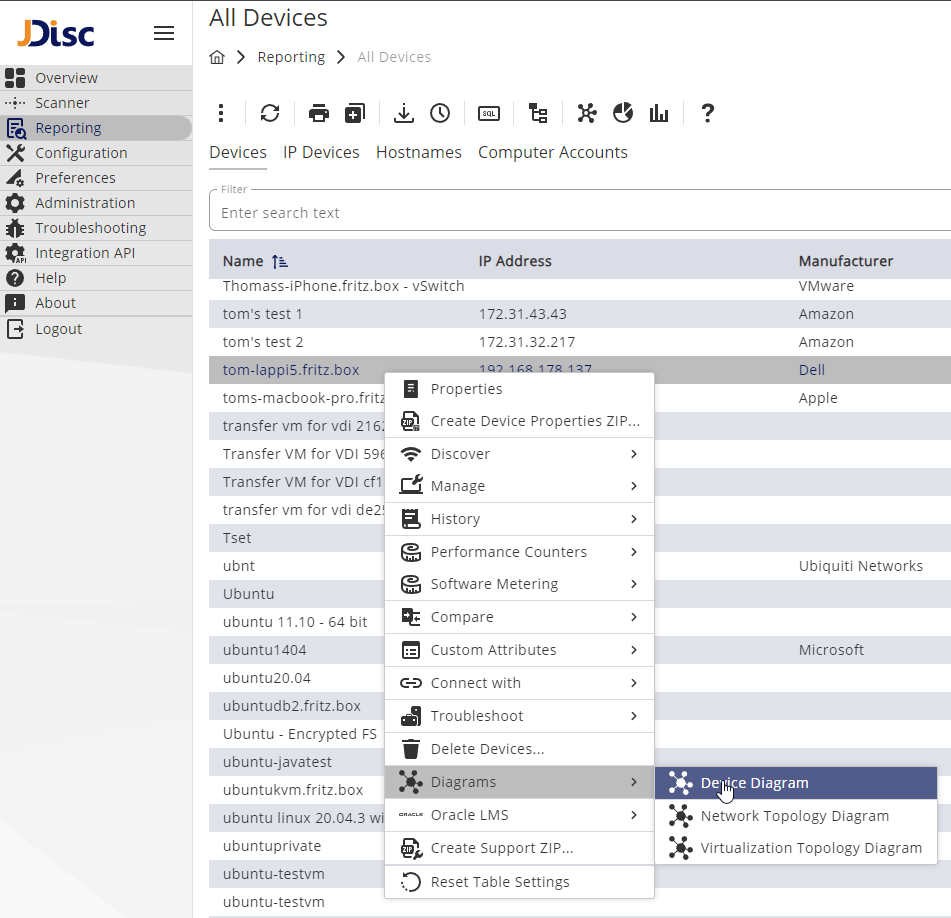
As a shortcut, you can access an “Entity Diagram” from the respective table toolbar icon when a table row (a device) is selected. This opens a basic diagram with one entity node which is the selected device.
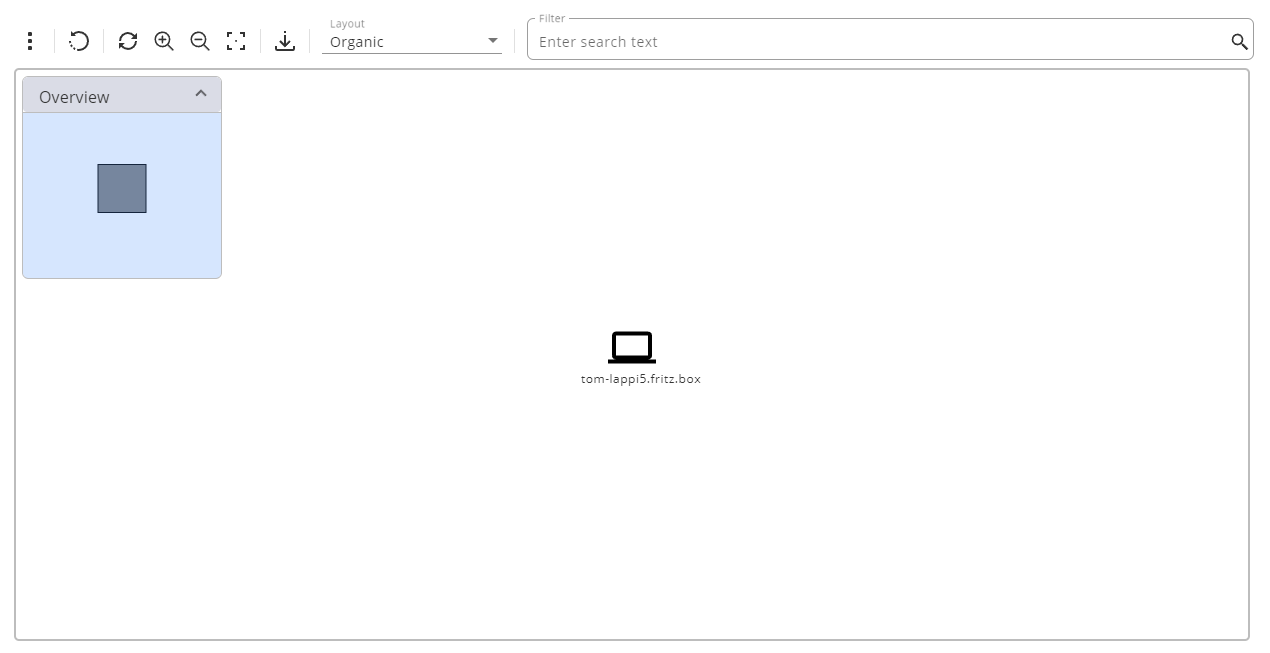
Diagram Control
On the top of the diagram, you can find the vertical context menu and the toolbar action buttons. From the diagram vertical context menu, you can change diagram preferences. From the toolbar action buttons, you can reset a diagram to the initial state, reload a diagram, zoom in and zoom out, center it, or export it in one of the supported export formats. Additionally, you can change the diagram layout or perform a text search.
Currently, we support diagram exports in the .svg file format. However, more export formats can be added in future releases if needed.
Moreover, searching for a text in the diagram highlights all potential matches. Especially for large diagrams, this is a nice feature which will help you identify nodes that you are looking for.
Furthermore, each diagram has an overview panel, which helps orientate within a diagram.
Relations
You can access the context menu of a diagram node by right-clicking on it or – primarily on mobile devices – by selecting it and then opening the diagram vertical menu.
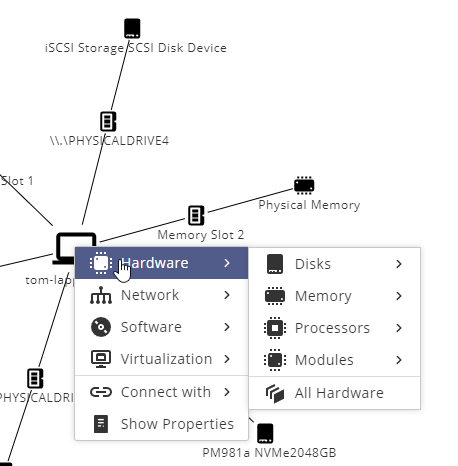
With the context menu, you can navigate to related information to this device. For example, you can fetch the directly connected devices to this device, hardware information, or the entire network topology starting from this device.
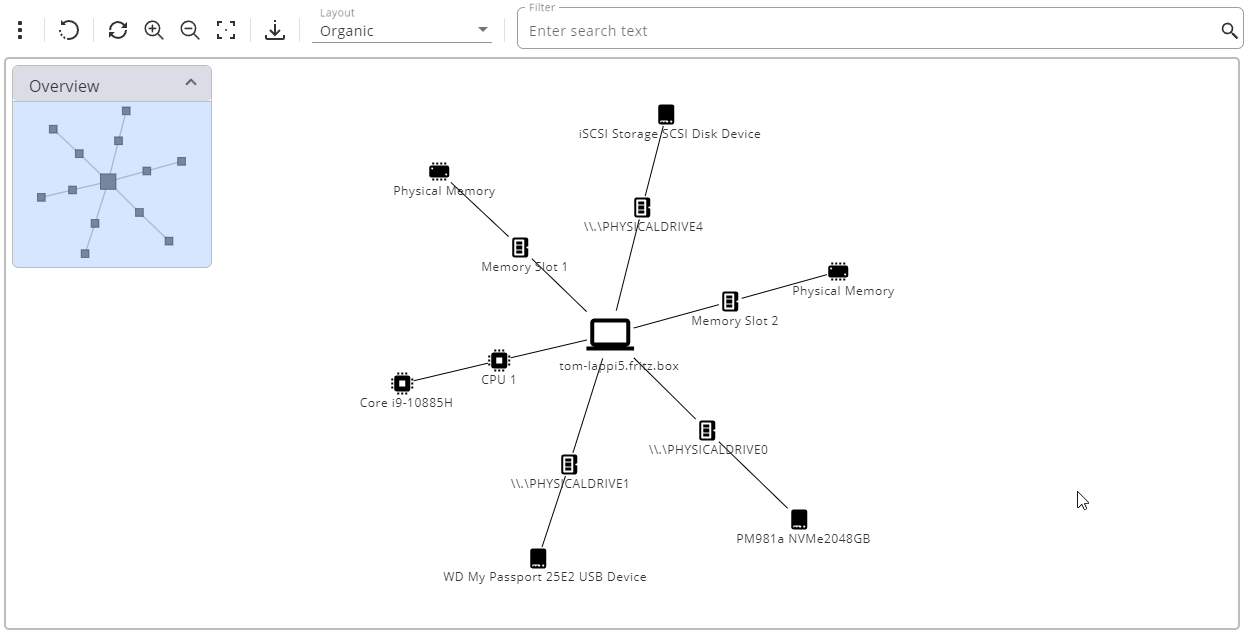
The context menu contains all the information that can be visualized for a specific entity node. Different entity nodes support of course different related information. You can expand the diagram by fetching the information that you need from node to node until the desired information visualization is reached.
In order to be able to have a complete overview of which relations are enabled for a node and which not, selecting a node opens a panel on the right side. On this panel, relations can be reviewed and edited according to the needs.
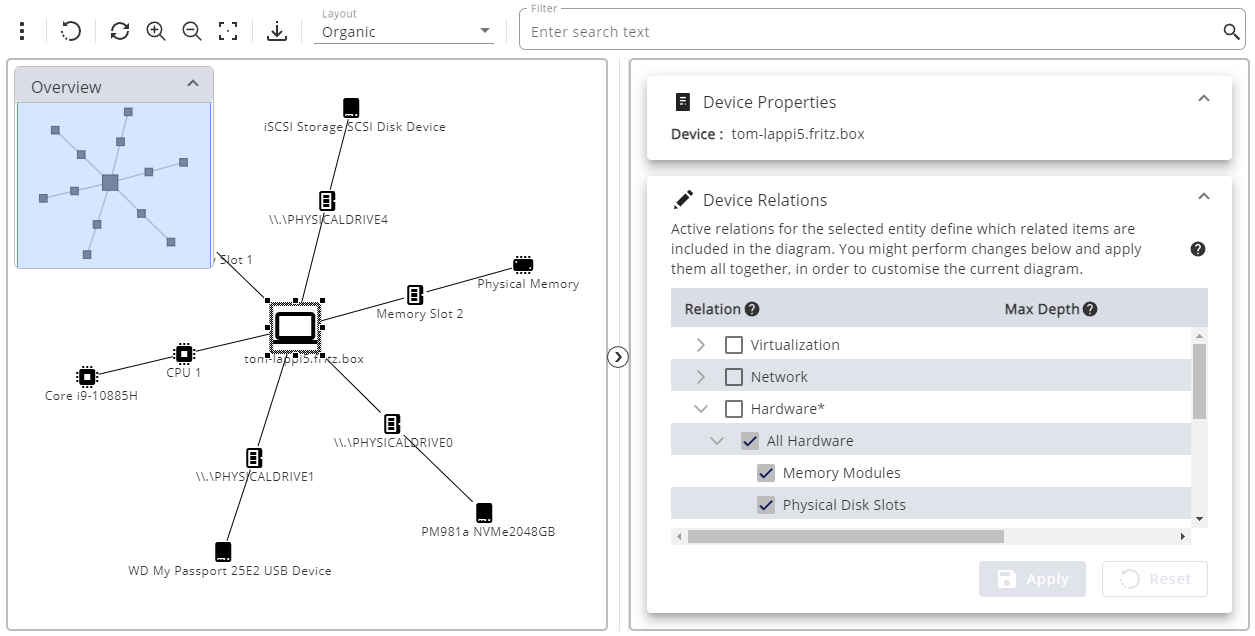
Naturally, by editing relations and hitting Apply, the diagram is re-drawn including the newly edited relations.
On top of this side panel, you can find entity-related properties. The property set will be extended in future releases.
Actions
At the end of the context menu, you can see the supported actions for this node. In our example, the device entity node supports the “Show Properties” and “Connect With” actions. Selecting the “Show Properties” action, will open in a new window or tab the complete device details.
Templates
In addition to single-entity relations, you can also select a so-called template. A template represents a set of relations that belong together. It is a way to apply a lot of relations with a single selection to direct and child nodes. For instance, the “All Hardware” template, will enable all hardware-related information. Another example of such a powerful template is the “Network Topology” template, which will eventually enable device-to-device connections to visualize the complete network topology.
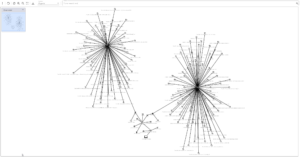
Depending on the environment and the relation settings, a template can fetch a lot of information, making the diagram huge and difficult to understand. By reducing the template relations or applying relations up to a certain depth helps reduce the information and keep the diagram readable. Furthermore, in case more space is needed, you can open the diagram in a new window or tab by clicking on the ![]() icon of the dialog header.
icon of the dialog header.
Configuration
You can change the preferences of a diagram by selecting the “Diagram Preferences” context menu item of the diagram vertical menu.
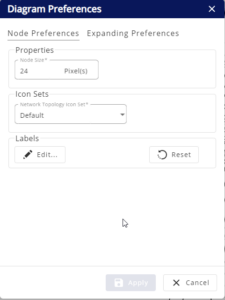
Currently, at the “Node preferences” tab, you can change the size of a node or how the node labels are created. For instance, it might be desirable for device nodes of type “switch” to contain also the device IPs. Additionally, for those of you that are more familiar to Cisco topologies, it is possible to use a Cisco specific icon set. This will render certain device nodes to the respective icons.
At the “Expanding Preferences” tab, you can change the default depth setting for all templates that support depth.
This configuration is persisted and is common to all diagrams. We plan to provide more preferences and the ability to store diagram-specific preferences in one of the next future releases.
Future Steps
We have not quite finished yet with the implementation of features in this area. In future releases, we plan to add the ability to export diagrams in different formats, as well as save and share them. We will add more relations and templates to diagram entities and the node properties will be extended with more information. Furthermore, we will provide the ability to visualize information flow and we will optimize large diagram presentation by introducing group and aggregation nodes, property-based filtering, etc.
Are you missing a feature that you would want to see in one of the next releases or would you like to suggest something new? We are always looking forward to getting your feedback and ideas. Just drop us an email or a comment below.
We hope that you enjoy the new feature!
Cheers,
Sotiris
