
Welche Datenbanken haben Sie im Einsatz?
Welche Benutzer nutzen diese Datenbanken?
Welche Editionen sind installiert?
Auf welcher Hardware (physisch, virtuell, cluster) laufen die Datenbanken?
Sind Sie über- oder unterlizenziert?
Steht ein Audit an?
JDisc Measurement Add-On
The Measurement Add-On gathers counter information for many devices and types. Simple graphs visualize the data.
- Printer
- Printed pages (total, b&w, color, duplex mode)
- Toner and ink level
- Windows Computers
- Use any Windows perfmon counter with user-definable templates
- Sensoren
- We can poll temperature and humidity values from many sensor devices
- PDU
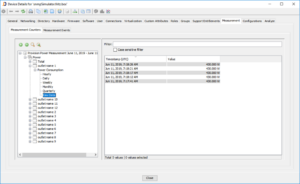
- JDisc Discovery gathers the current power consumption for each PDU socket
- Routers and Switches
- We collect traffic statistics such as transferred bytes and packets per network interface.
With this information, you always have current and historical usage information for your environment. This information helps to consolidate your environment or prepare cloud migrations.
Interactive Charts
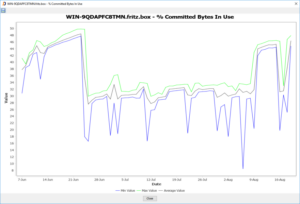
Our built in interactive line charts graphically visualize the usage over time. Peaks and lows can easily be identified.
Windows Perfmon Data
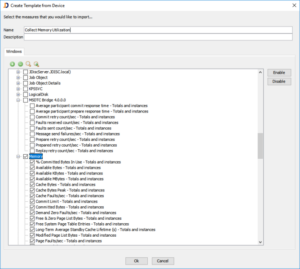
Define individual templates for Windows. A template may contain any counter offered by the Windows Perfmon infrastructure. Deploy any number of templates to a device.
Page Counters for Printers
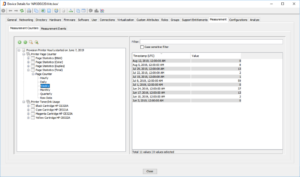
For most printers, we collect the number of printed pages (total, color, b&w, duplex) and toner/ink levels. Aggregations show the values on an hourly, daily, weekly, monthly, or quarterly base.
Packets and Traffic Counter for Switches
Switches and routers provide interface statistics such as packets per second, bytes sent, and more.


