Why Supportability is so important to us

Dear JDisc users,
do you feel like the guy in the image when talking to support hotlines? Are you playing ticket ping pong with the support engineer who is permanently asking for new log files or further information? This troubleshooting process can be very time-consuming and frustrating on both sides. At JDisc, we have always taken supportability very seriously. We would like to minimize frustration on the customer side and speed up the troubleshooting on our side. Every minute that we spend on troubleshooting is a minute that we can’t invest in developing new features.
The central piece of information to assist our troubleshooting operations is our support ZIP. Whenever you have an issue with a device or the server, our support asks for a support ZIP. Support ZIPs include all information required to find the root cause of a discovery issue. It includes the device data, the discovery log for a particular device, and the server logs, which might include error messages and exception logs. Usually, we can have a one-stop support experience by analyzing the information in the ZIP file.
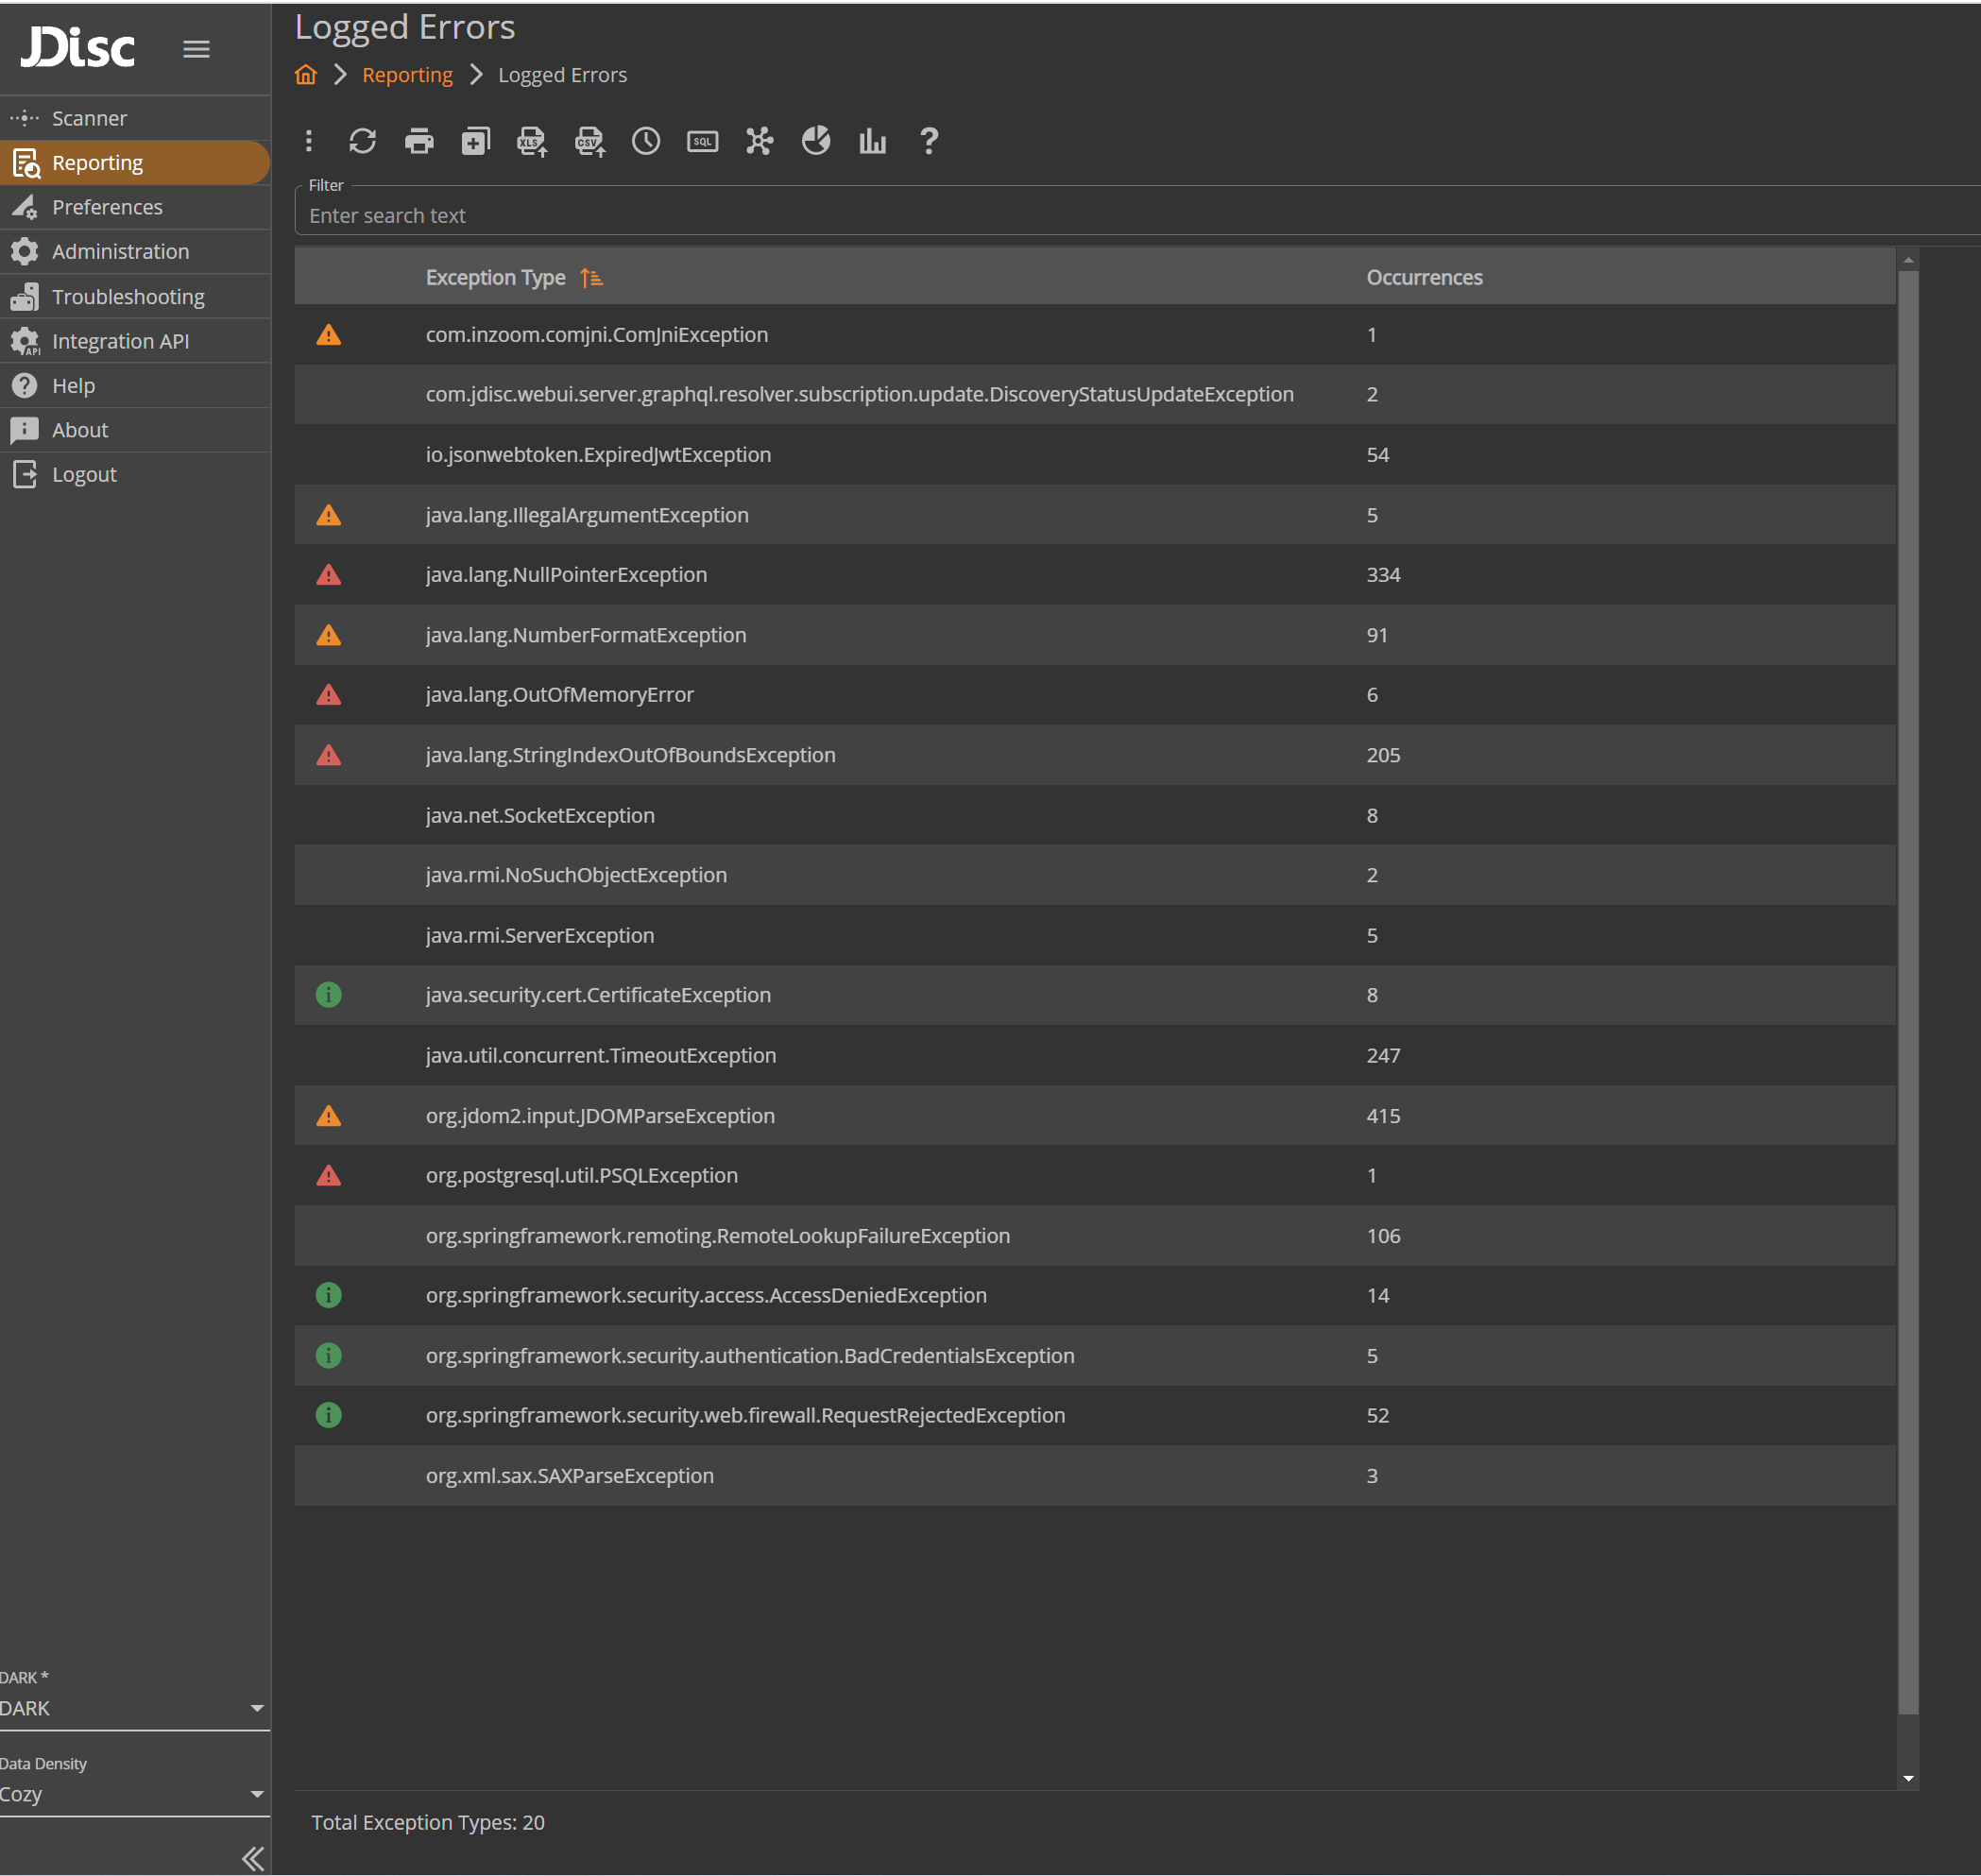
To enhance the process and allow us to quickly identify possible programming issues, we have added new reports that can provide an overview of the current log files. The new reports scan the log files and gather information over the reported errors and exceptions that have occurred. The reports are added on both our Inventory Client and our alpha version Web UI, under the troubleshooting menu and reporting dashboard respectively. The basic report “Logged Errors” provides some error statistics and lists the occurred exception types and the number of occurrences for each. This way, we can take a first look on logged errors and detect critical issues, non expected exception types, suspicious repeatedly occurring issues, or errors with known possible solutions, like ‘Out Of Memory’ errors.

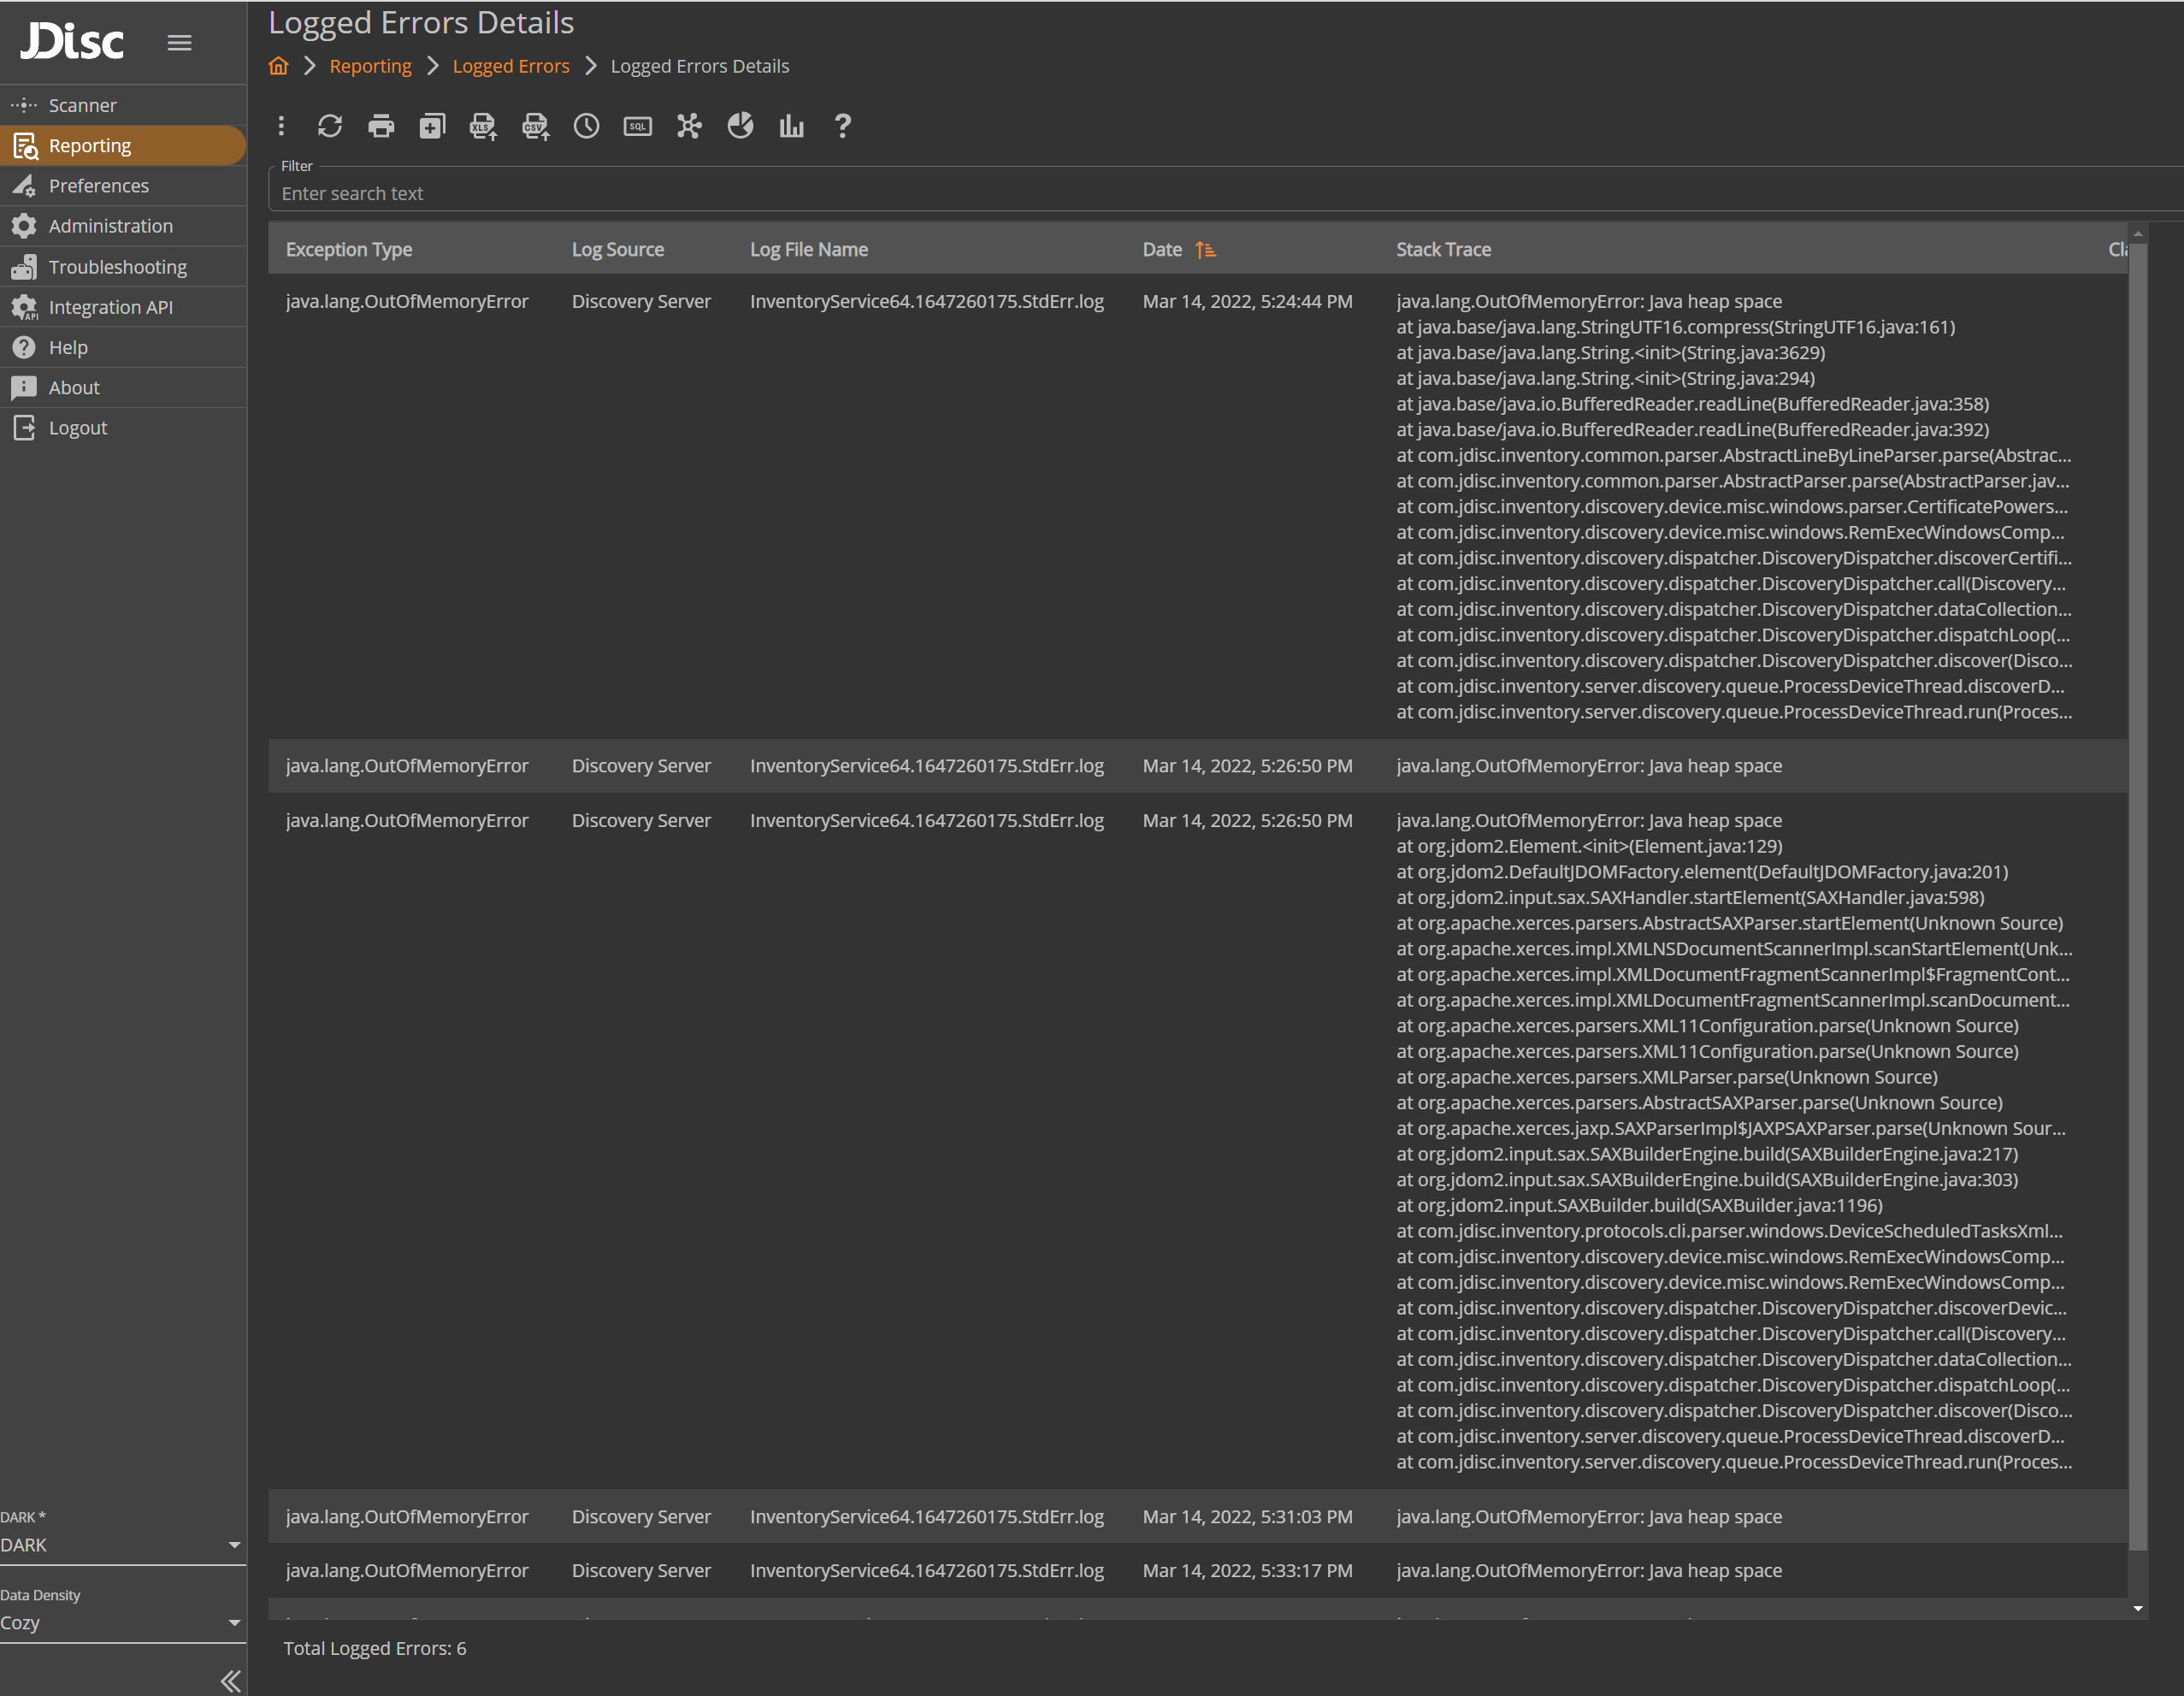
When needed, we can dig deeper into the logged exceptions and check every occurrence, by opening the details about one or more exception types. This can be done easily from our UI and brings up the detailed report, where we show all logged errors for the asked exception type(s). The shown information contains, among other, the log file where the error was reported, the date and the complete stack trace, which may show where exactly the problem begun in the code. This information is very useful to our support and development team, and can be used in order to provide fixes and solutions, without even having to refer to the support ZIP. Of course, the reports do not substitute the troubleshooting means that the support ZIP provides, but can be a great assistant as a first step to the whole troubleshooting process, which might save much time on both sides, customer’s and ours, when issues occur.

We really hope you will never need to utilize this new feature, but we feel this will be a valuable addition to our supportability services.
Cheers,
Fotini
