


How much Traffic is caused by the Discovery?
Dear JDisc friends,
a frequently asked question that arises from customers and prospects is: how much traffic does the discovery put on the network? Of course, it is not easy to answer this question. There are many factors that influence the generated traffic for a device. For instance, the device type is a major criteria. Scanning printers causes much less traffic compared to scanning a Windows server. The reason is that we collect a lot less information for printers than for Windows servers. Another aspect is the used protocol. Protocols differ in their efficiency and that results in more or less network traffic. And the last aspect is about what is installed on a device and how a device is configured. For instance, when we have an Oracle database, then we might read larger Oracle config and inventory files. This causes additional traffic compared to a similar server without a database instance.
But where do you find the information about the traffic? Currently, the statistics are being written to the discovery log. For instance, when you scan your switch, the statics might look like the following sample output.
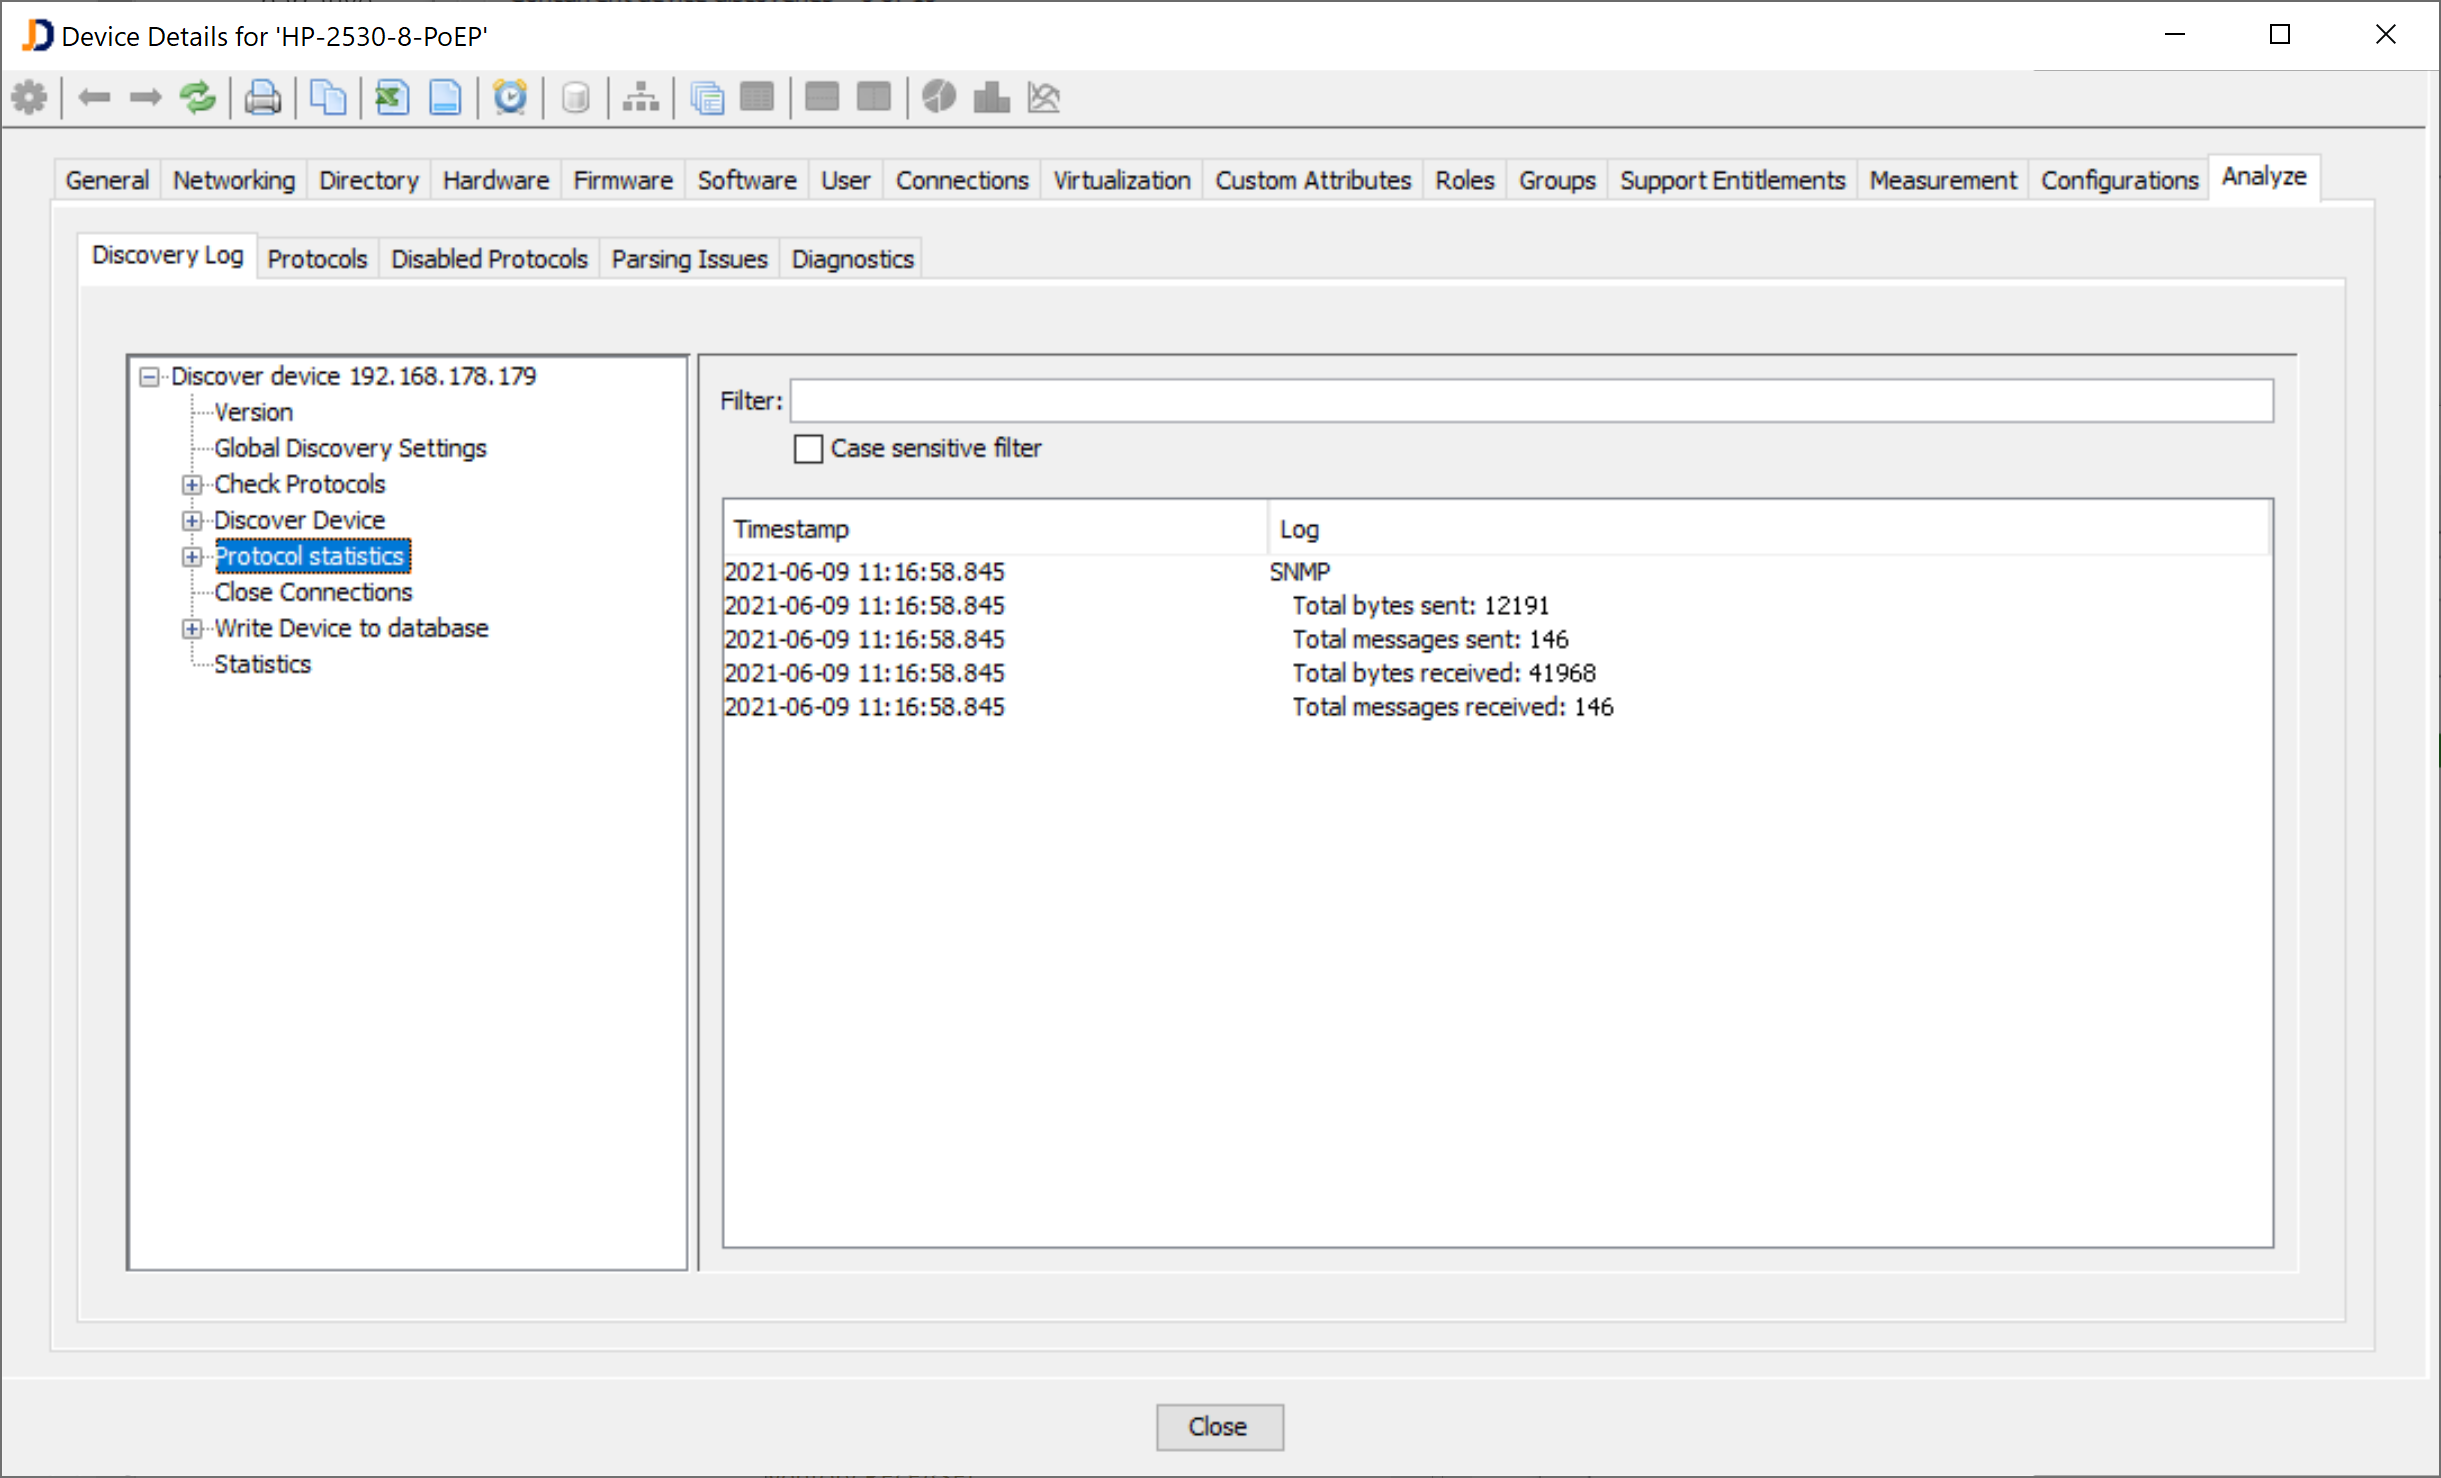
The SNMP statistics display the number of bytes sent, the number of messages sent, the number of bytes received and messages received.
When you scan a Linux computer (with not too many applications installed), the we also count the traffic caused by the telnet/ssh communication.
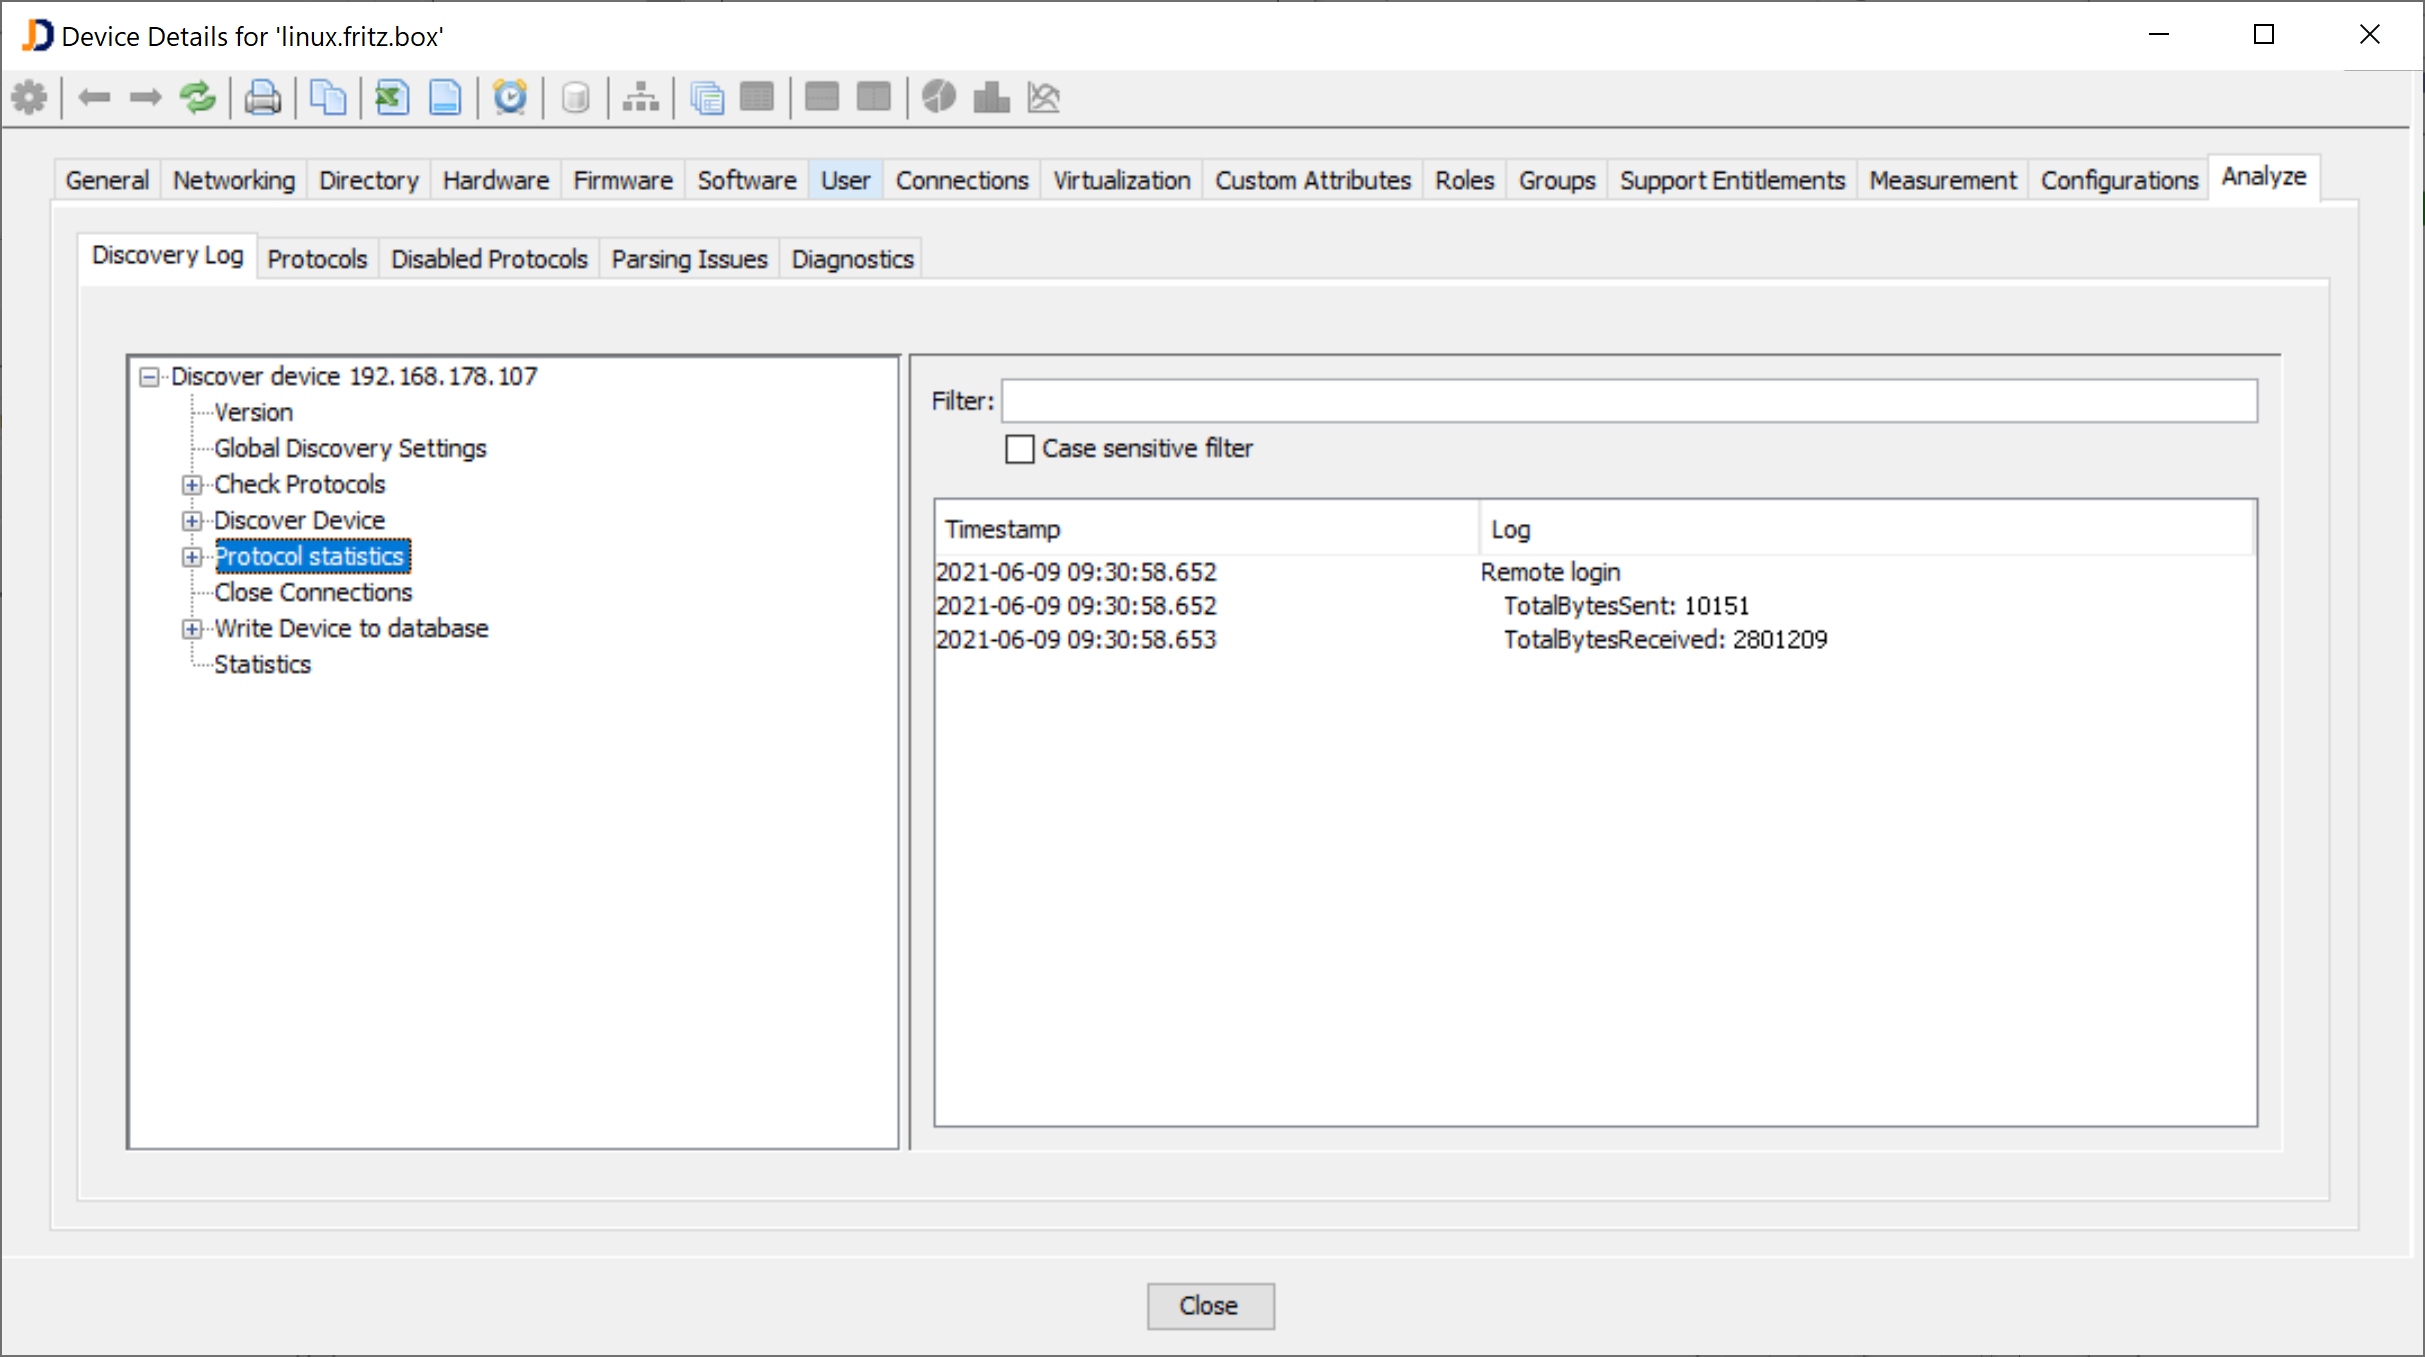
Unfortunately, we don’t get the packet count, but at least, we get the bytes transferred and received.
And there is also another drawback. We don’t get those counters for all protocols we are using. For instance, we don’t get information about the transmitted number of bytes for WMI or remote registry queries. However, at least, you get information for the most important protocols.
We might extend the discovery to store the traffic also in separate database tables. That would allow us to create statistics about the average discovery traffic caused by operating systems, types, or models.
Hope you like this features (coming with build 5070)…
Cheers,
Thomas

Comment (1)
Thomas Trenz / June 16, 2021
Just one more comment. Starting with build 5071, we also store the traffic information in a separate table within our database. That makes it easier to create reports with the discovery traffic or use this information in your custom queries.