Network Discovery: Clarity with our Charting Dashboard

business

business Laptop with statistics imageHello JDisc Friends,

Network Discovery is essential for a well managed IT environment. With our JDisc Discovery built-in reports and your custom reports, you have achieved a very good understanding of your IT landscape. But is it enough?

In order to help you in this direction, we have just implemented in our new Web UI the overview dashboard. In this dashboard, it is possible to create your own charts by utilizing your report data.
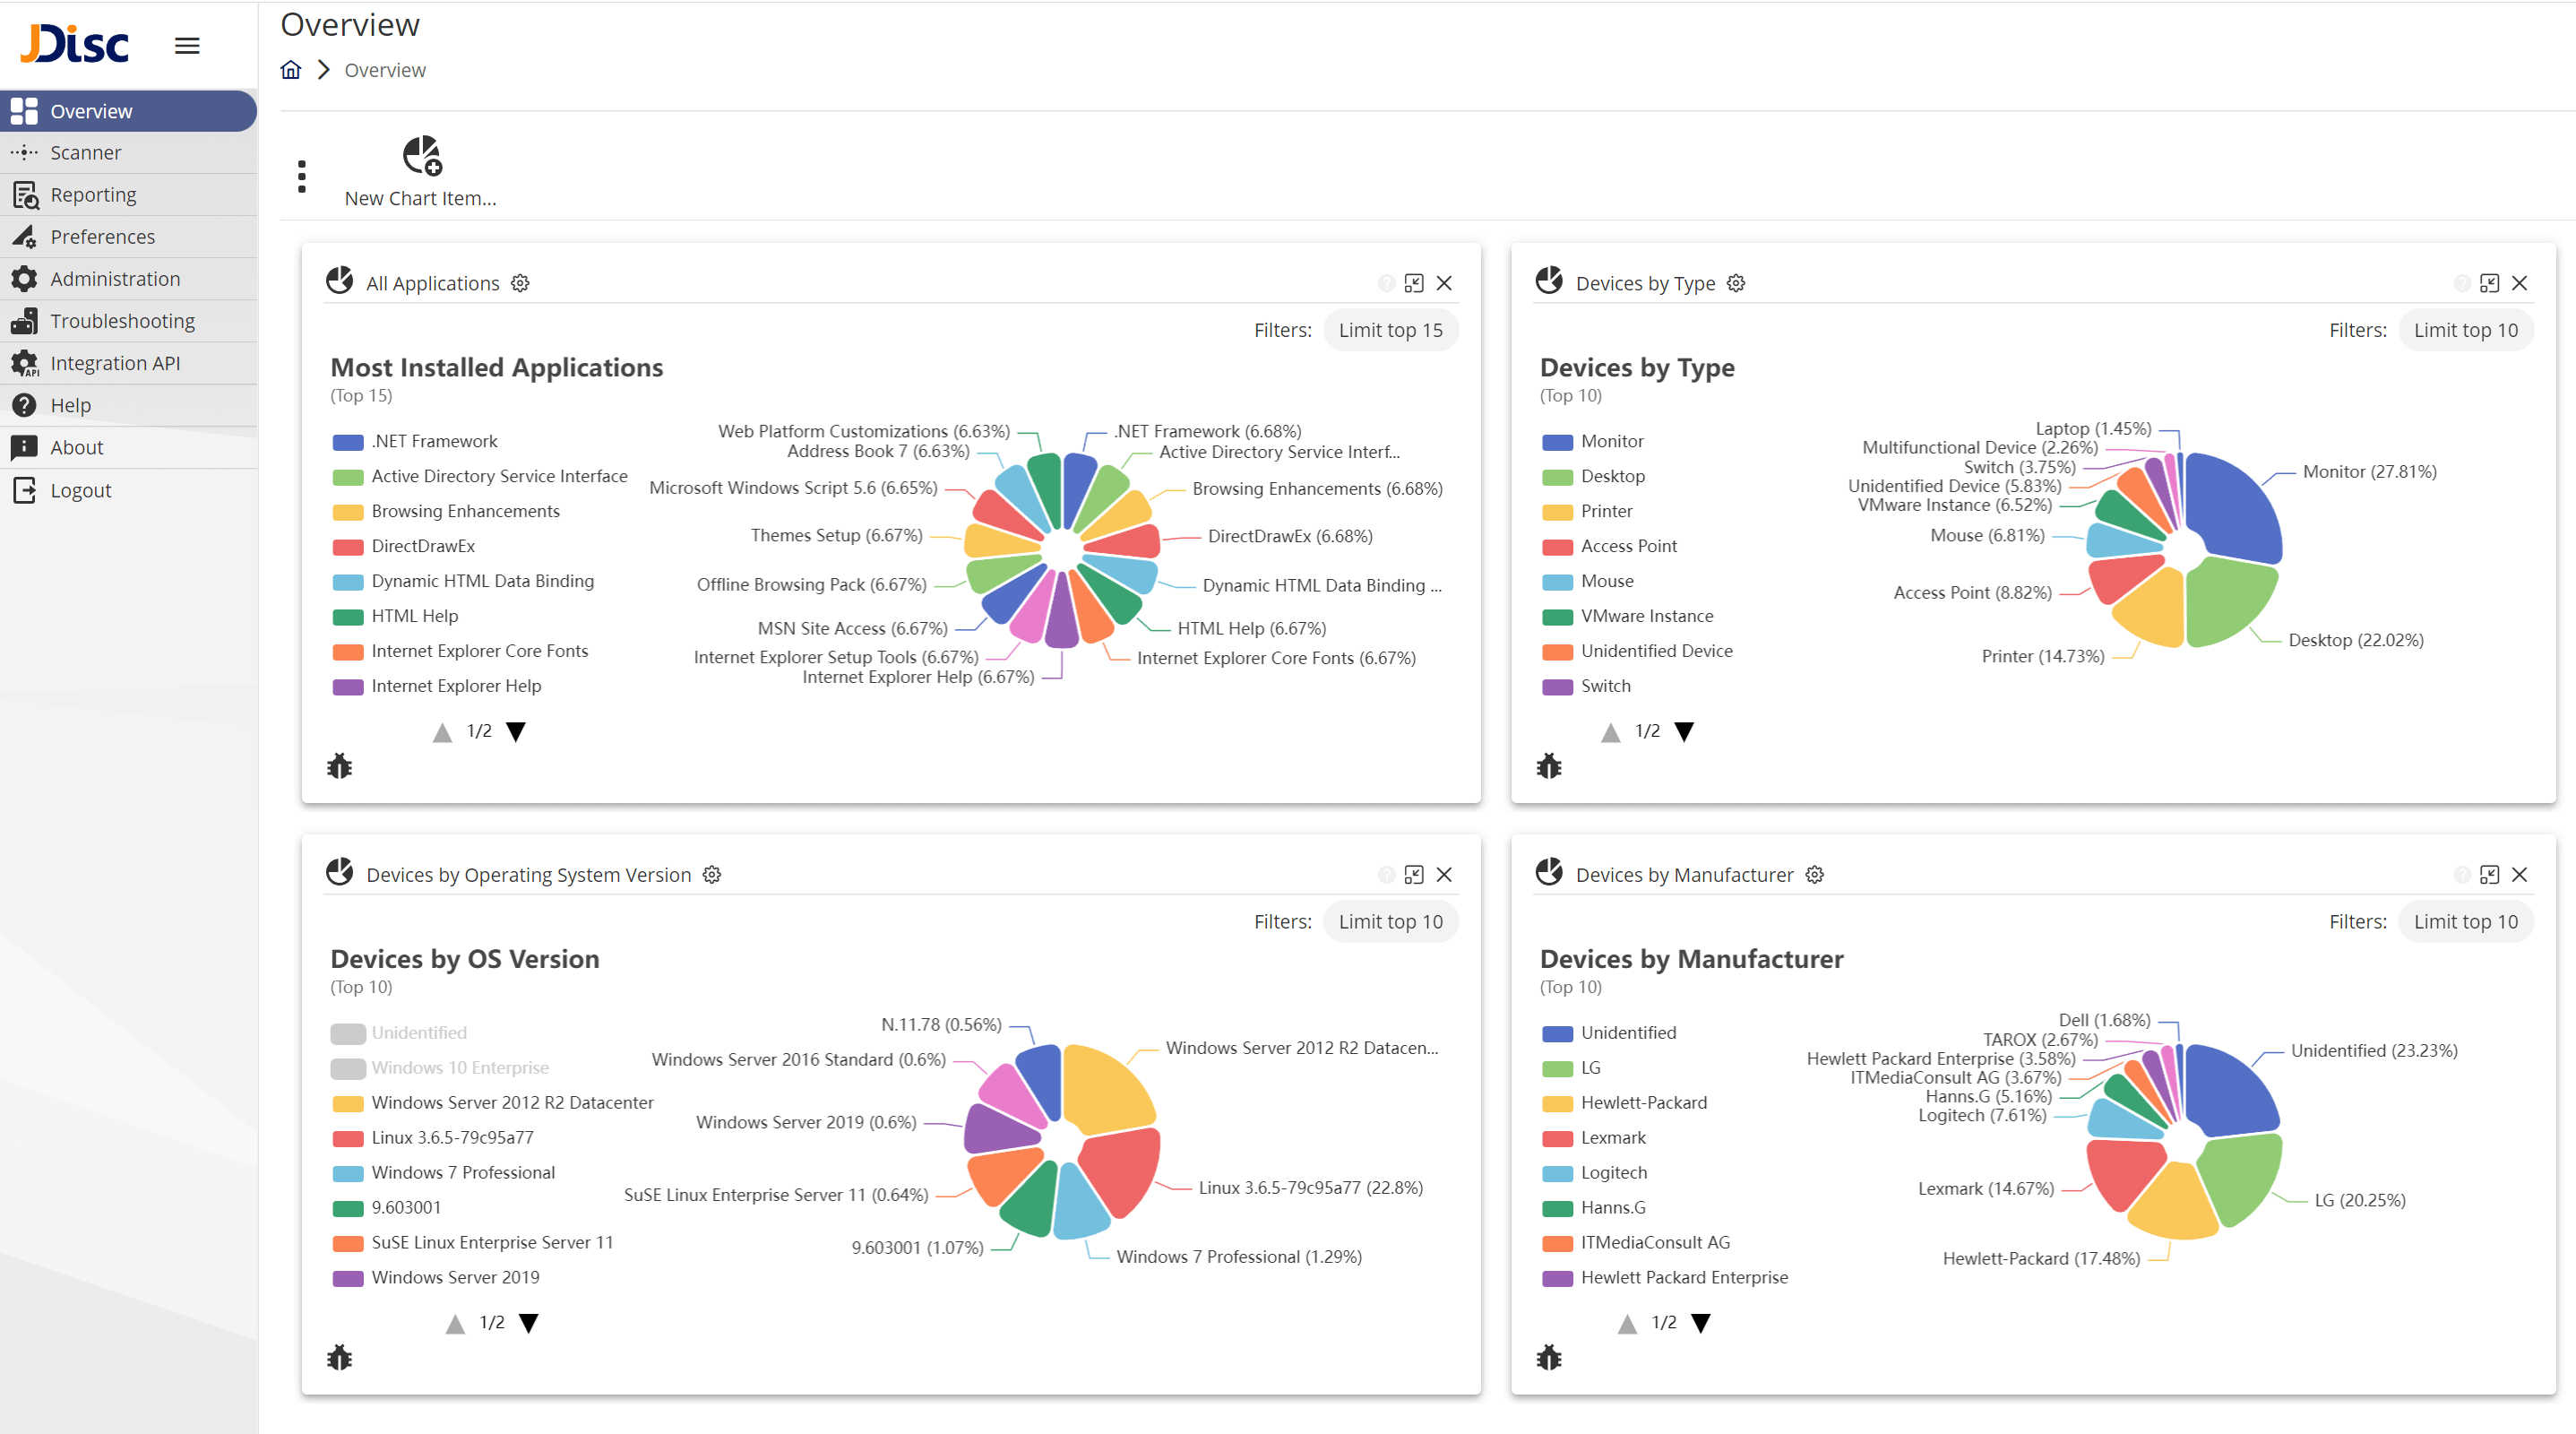
2022-10-21-16_30_06-JDisc-Discovery Overview Dashboard
Overview dashboard

From Release 5434 onwards, the overview dashboard includes some default charts. The default charts can be removed or edited at your will. New charts can also be created by using the new chart wizard.
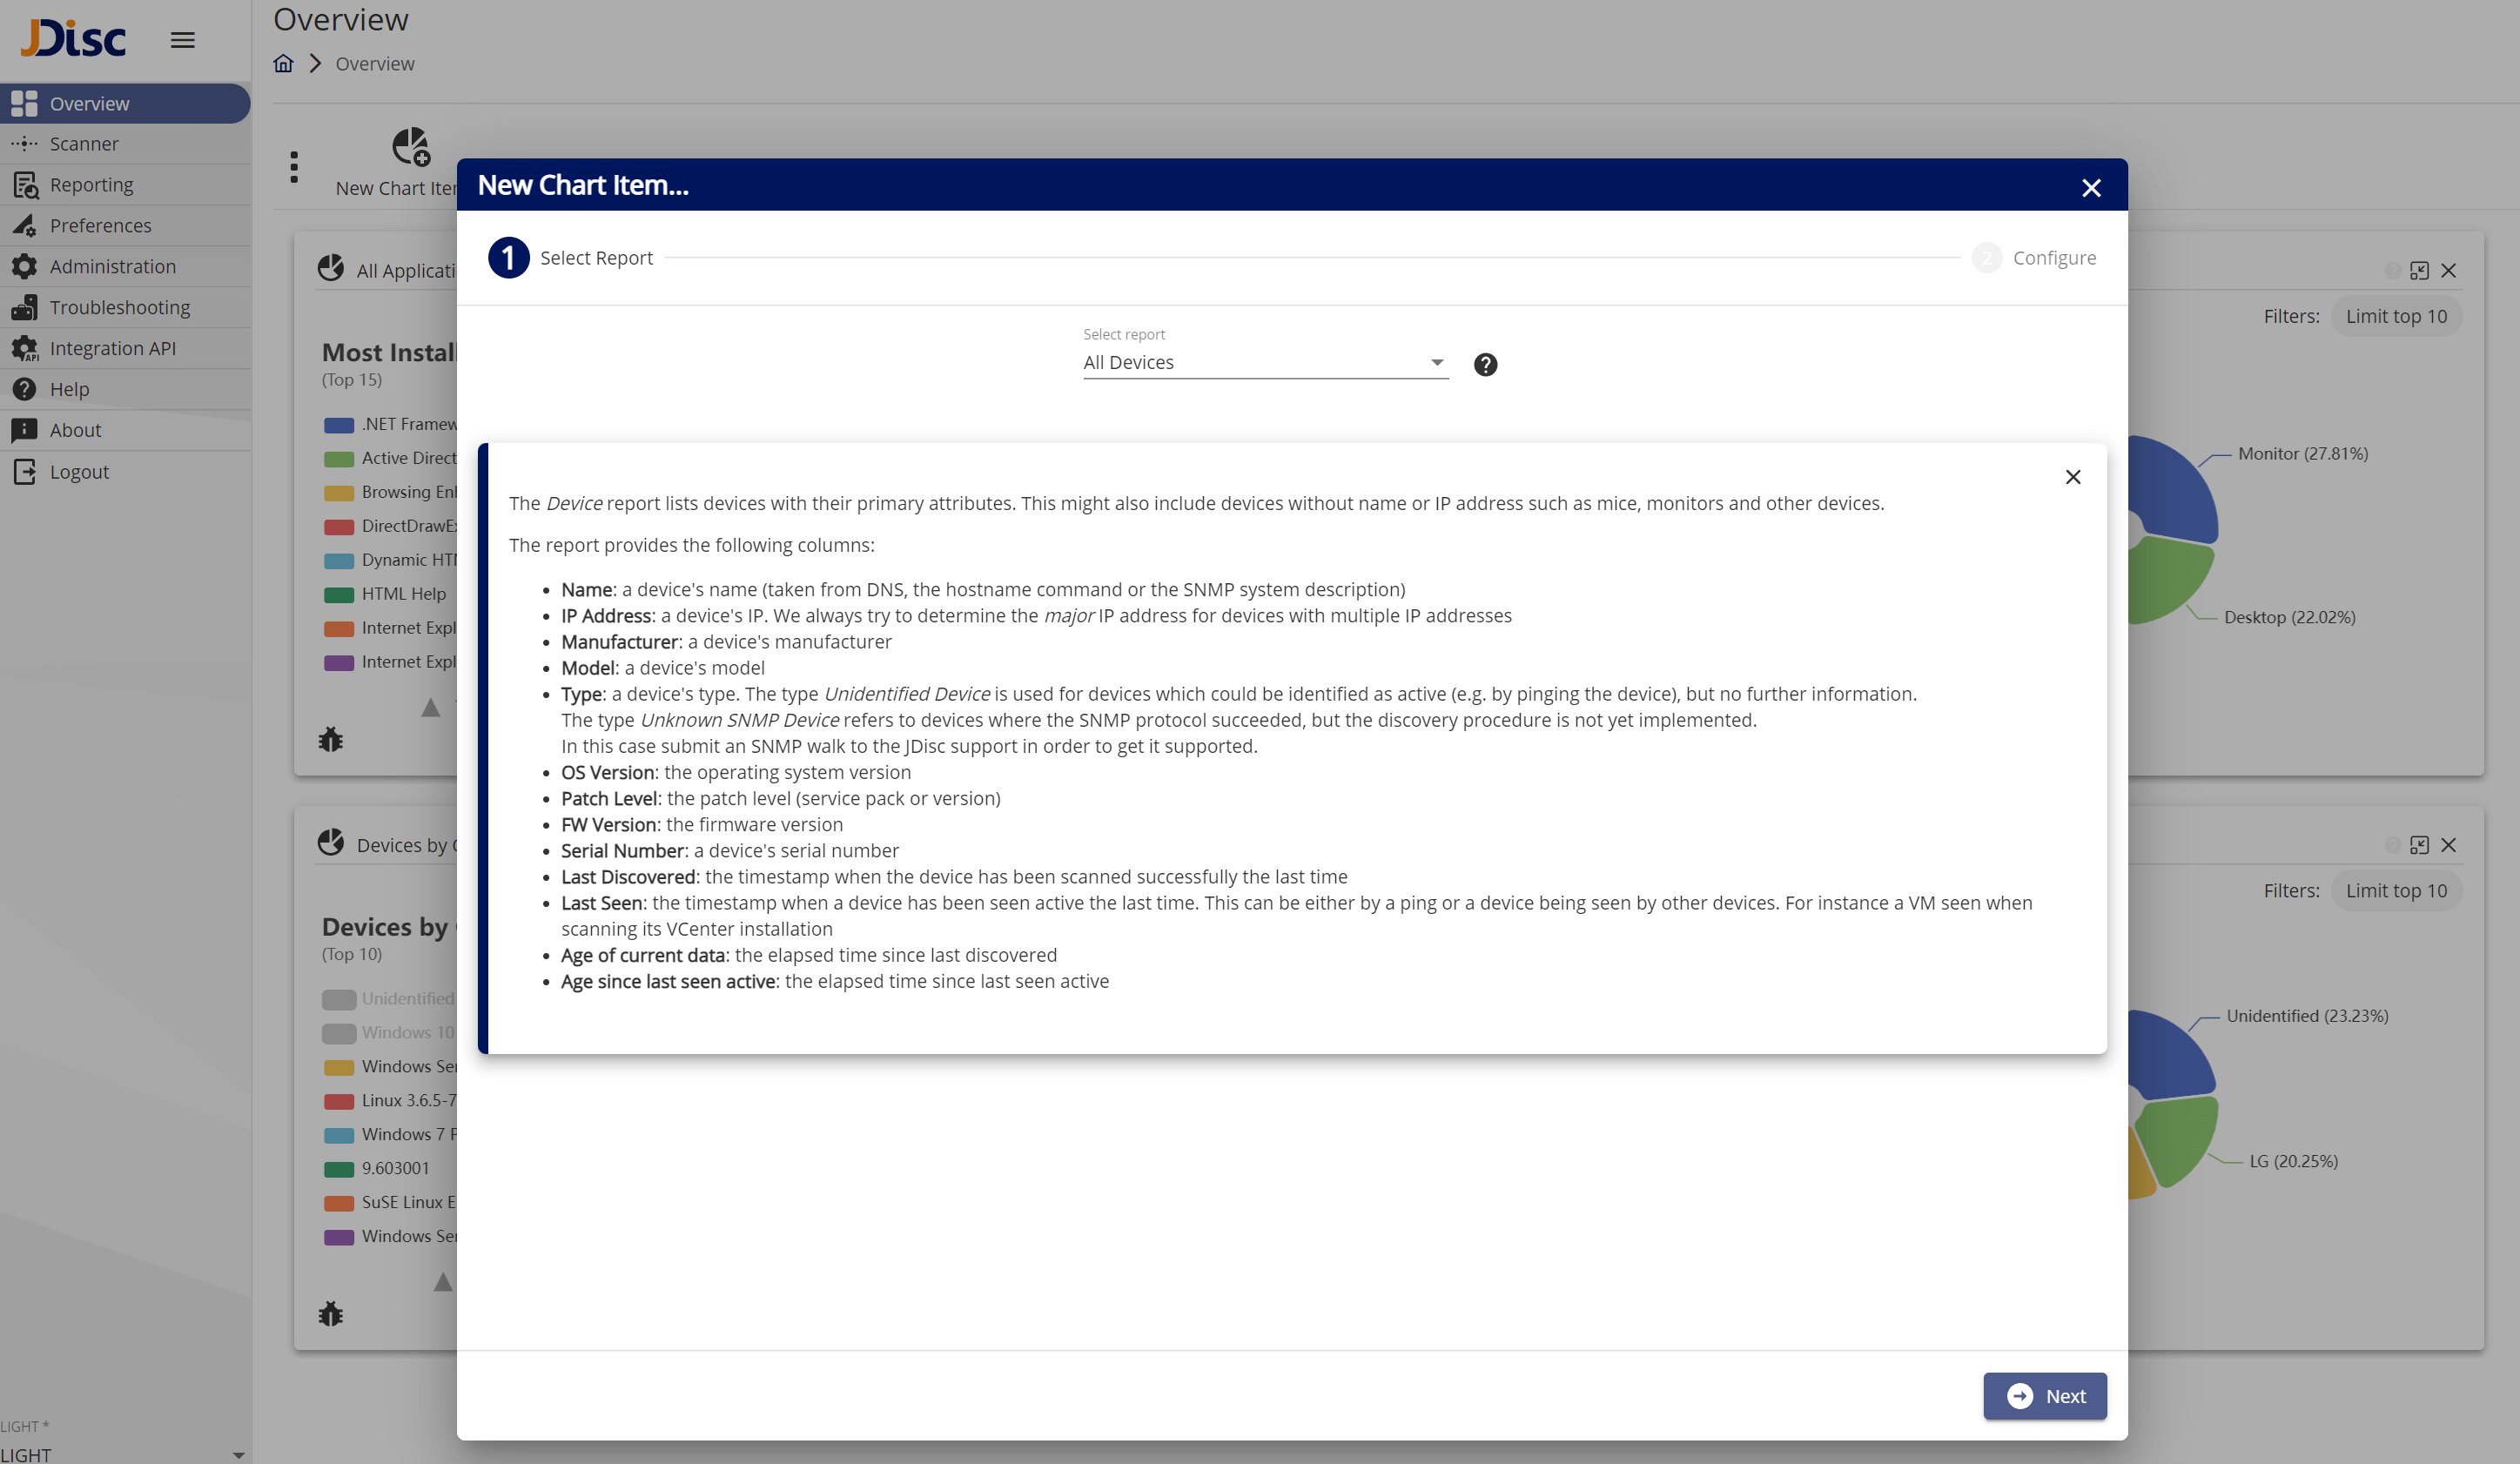
2022-10-21-16_31_34-JDisc-Discovery Overview Dashboard Charts
New chart item wizard

For the first release, only a subset of the built-in reports are included. However, we will include more and more reports in the next releases. Additionally, new features will also be included, such as:

  • Sharing custom dashboards between users
  • Additional chart types
  • More configuration options
  • etc.

Do you like this new feature? Just download and install our latest Release and try it out!

Do you have any suggestions? Do you have some ideas that you would like to be implemented? We are always happy to hear your feedback; either positive or negative.

Cheers,

Sotiris

About The Author

Sotiris Zdragkas
I am software engineer at JDisc, working primarily on the design and implementation of the new Web UI. Before I started at JDisc, I have been developing software for complex and distributed systems for many years in the automotive industry. Feel free to contact me on LinkedIn.

Leave A Comment

Netzwerk Inventarisierung: Übersicht mit Charts!

business

business Laptop with statistics image

Hallo JDisc Freunde,

Eine akkurate Netzwerk Inventarisierung ist die Basis für effizientes IT Management. Mit den in JDisc Discovery integrierten Berichten und Ihren eigenen Berichten haben Sie bereits ein sehr gutes Verständnis Ihrer IT-Landschaft erreicht. Aber ist das genug?

Um Ihnen in dieser Richtung zu helfen, haben wir gerade in unserer neuen Web UI das Übersichts-Dashboard implementiert. In diesem Dashboard ist es möglich, Ihre eigenen Diagramme zu erstellen, indem Sie Ihre Berichtsdaten verwenden.


2022-10-21-16_30_06-JDisc-Discovery Overview Dashboard
Overview Dashboard

Ab Release 5134 enthält das Übersichts-Dashboard einige Standarddiagramme. Die Standarddiagramme können nach Belieben entfernt oder bearbeitet werden. Neue Diagramme können auch mit Hilfe des Assistenten erstellt werden.

2022-10-21-16_31_34-JDisc-Discovery Overview Dashboard Charts
Neues Diagramm erstellen

In der ersten Version ist nur eine Teilmenge der integrierten Berichte enthalten. In den nächsten Versionen werden wir jedoch mehr und mehr Berichte einbeziehen. Darüber hinaus werden auch neue Funktionen enthalten sein, wie z. B:

  • Gemeinsame Nutzung benutzerdefinierter Dashboards durch mehrere Benutzer
  • Zusätzliche Diagrammtypen
  • Mehr Konfigurationsoptionen
  • usw.

Gefällt Ihnen diese neue Funktion? Laden Sie einfach unser neuestes Release herunter, installieren Sie es und probieren Sie es aus!

Haben Sie irgendwelche Vorschläge? Haben Sie Ideen, die Sie gerne umgesetzt sehen würden? Wir freuen uns immer über Ihr Feedback, ob positiv oder negativ.

Grüße
Sotiris

Leave A Comment