WebUI: New Scanner Component

Scanner_featured

Dear JDisc friends,

we continuously extend our WebUI with new features, and at the same time we migrate existing features from the standard JDisc Discovery client. However, sometimes a redesign is necessary in order to improve the usability of our user interface. The new scanner component provides now a better overview of the discovery process.

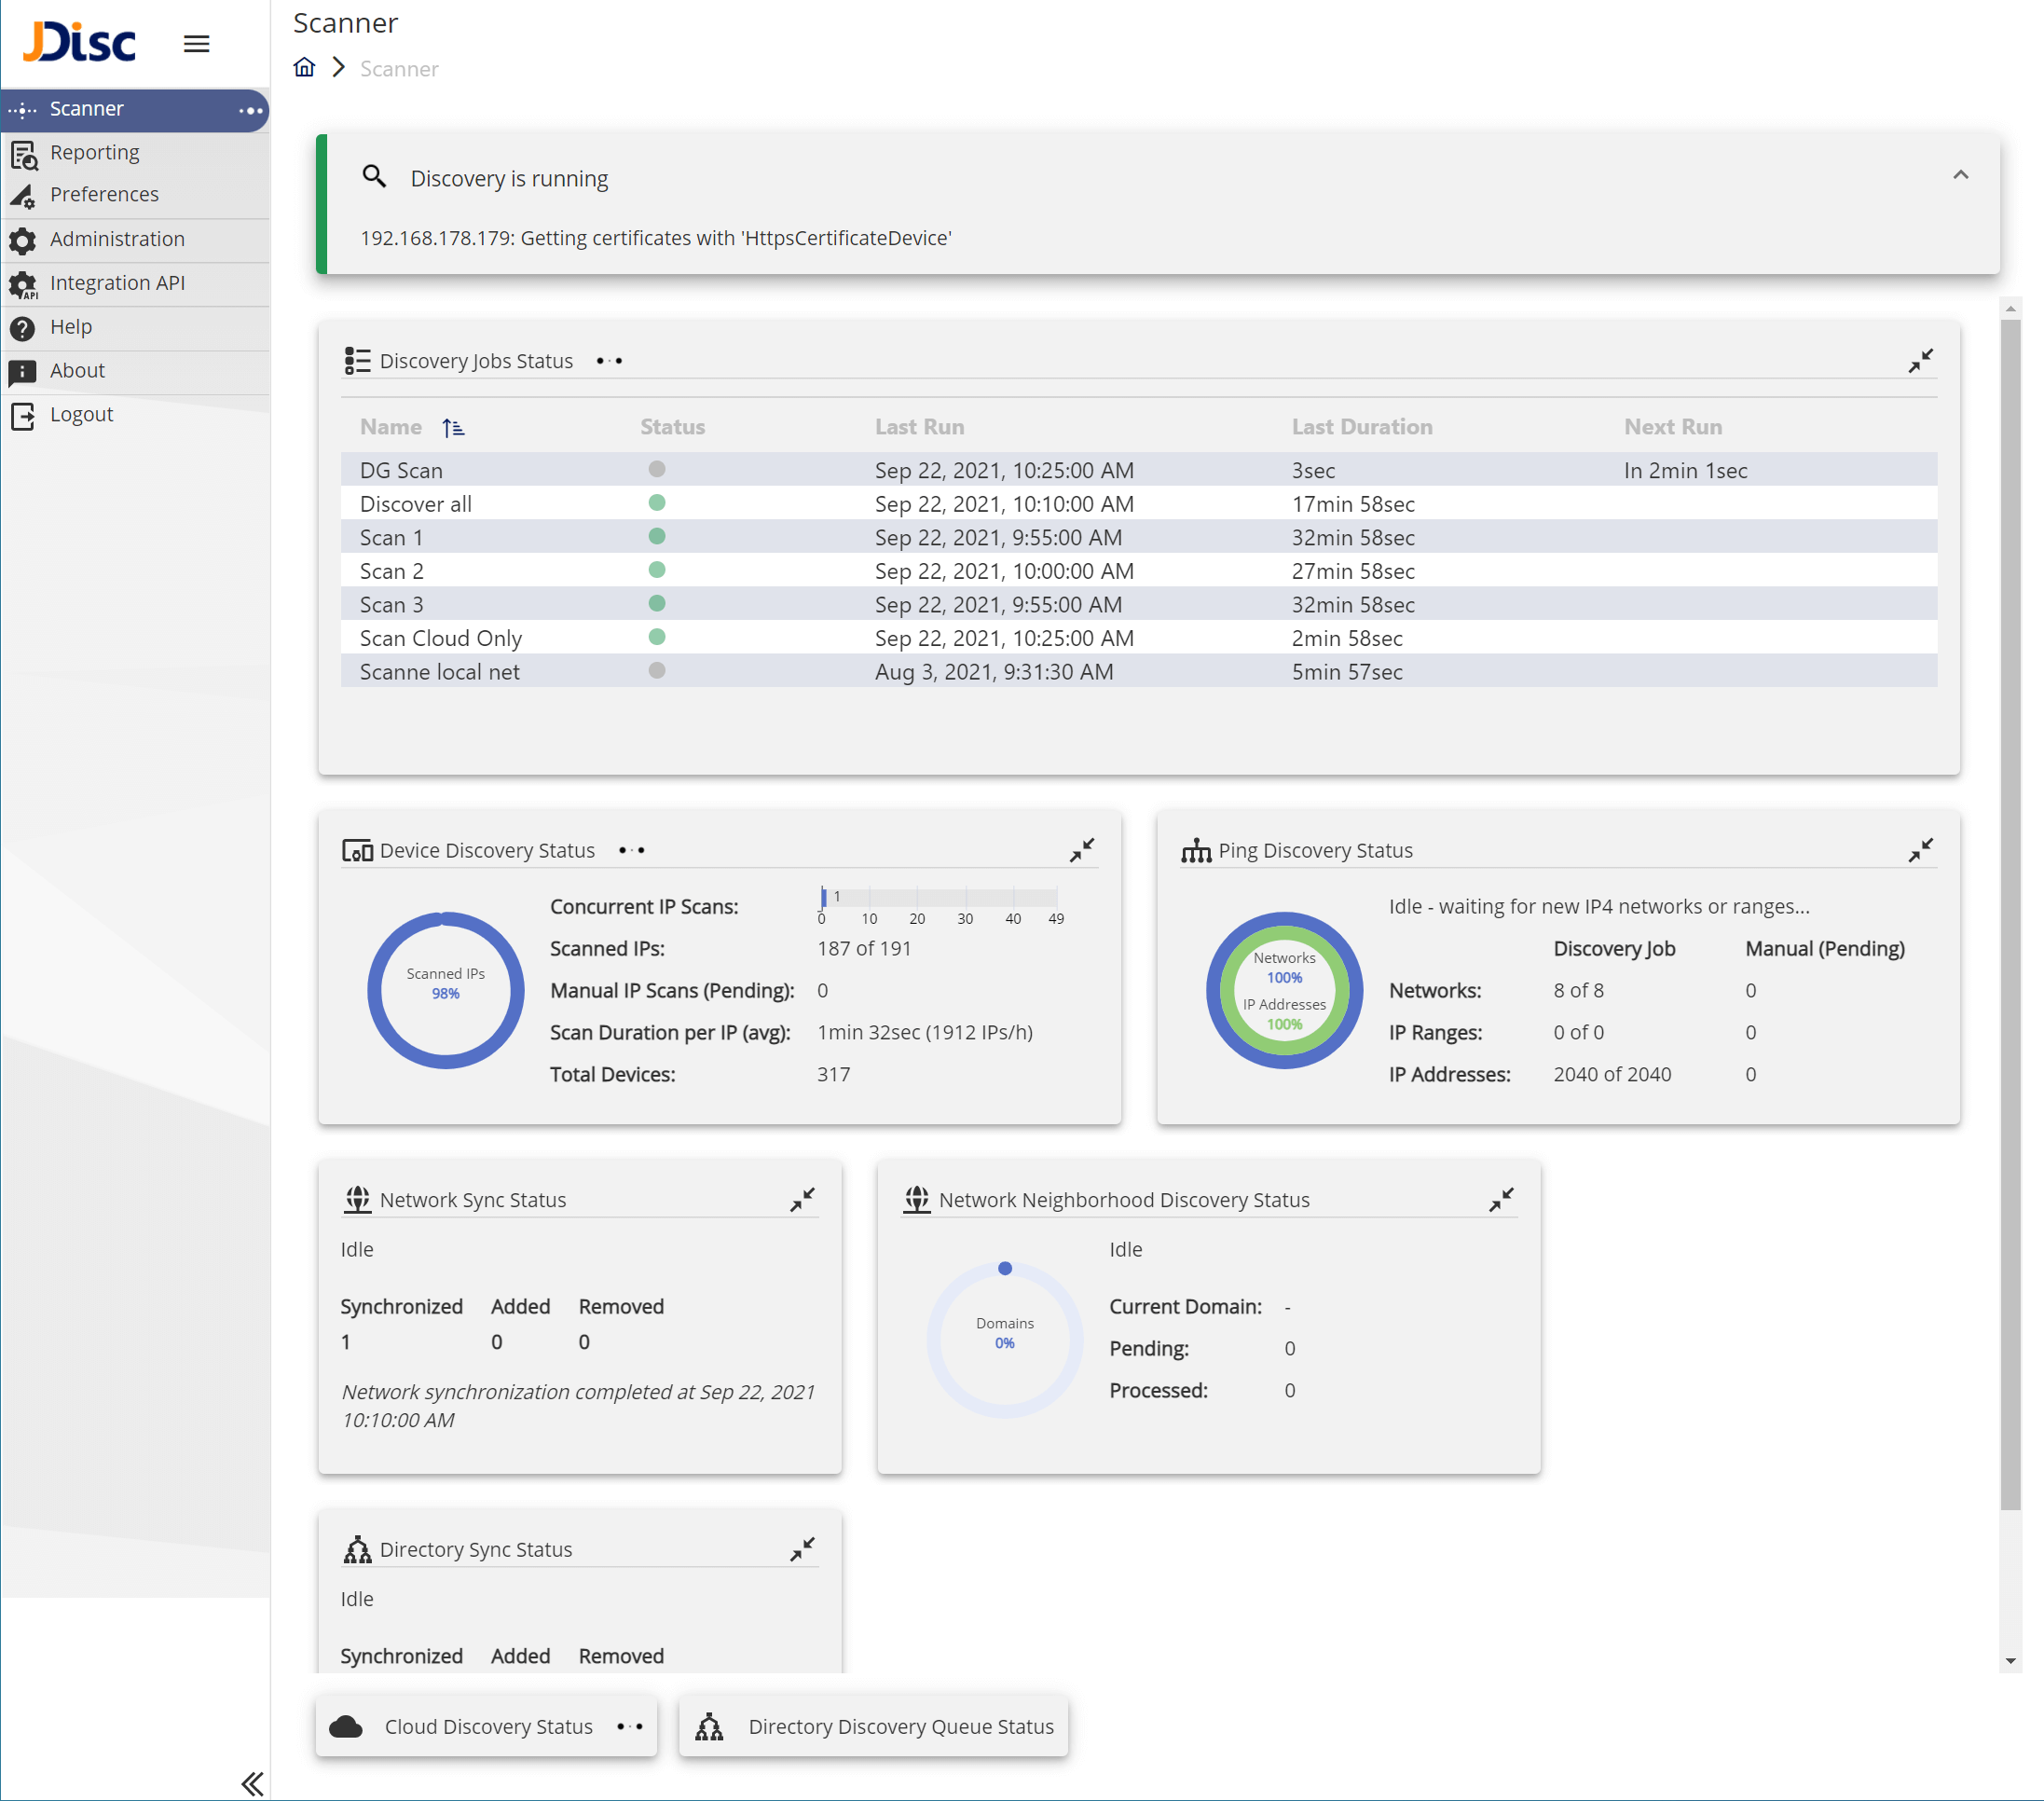
Multiple dashlets compose the scanner dashboard. Each one of the dashlet communicates information about a specific discovery process. It is possible to re-arrange the dashlets of the dashboard. Moreover, active scanner and active dashlets are recognized by the animated three dots. [icons8-dots-loading ]

Scanner_compressed scanner dashboard
Scanner Dashboard

Dashlets

Here is a short explanation of the most important dashlets.

Discovery Overview

This dashlet is fixed on top. It presents always the current state of the discovery process. Additionally, – when available – you can see a message which gives better insights of what is going on under the hood.

Discovery Jobs Status

This dashlet lists all configured discovery jobs. A blinking green dot signals that a job is active. Additional discovery job information like for instance the duration, the scheduled next run date and time is also part of this dahslet.

Device Discovery Status

Each and every device in the network is assigned to an IP Address. Therefore, an important step of the discovery process is to scan these devices behind the assigned IPs. With this dashlet you can monitor the progress of this discovery step. Moreover, useful information like how many devices are scanned at the moment, how many IPs are left to be scanned, as well as scan performance and discovered devices is part of this dashlet.

Ping Discovery Status

The discovery process pings configured networks, IP ranges and IP addresses. This dashlet provides information about exactly this discovery step.

Cloud Discovery Status

This dashlet provides information about the cloud discovery process for all configured cloud subscriptions. You can monitor the discovery progress for each cloud environment together with the overall status of the cloud discovery process step.

Dashboard

Minimizing Dashboard Items [Screenshot 2021-09-22 121507 ]

Last but not least, the dashboard items have been given the opportunity to be minimized. This would enable you to focus on items that you use more frequently and set aside the ones that are irrelevant to you. Minimized items will be placed at the bottom of the dashboard and can be restored again by simply clicking on them.
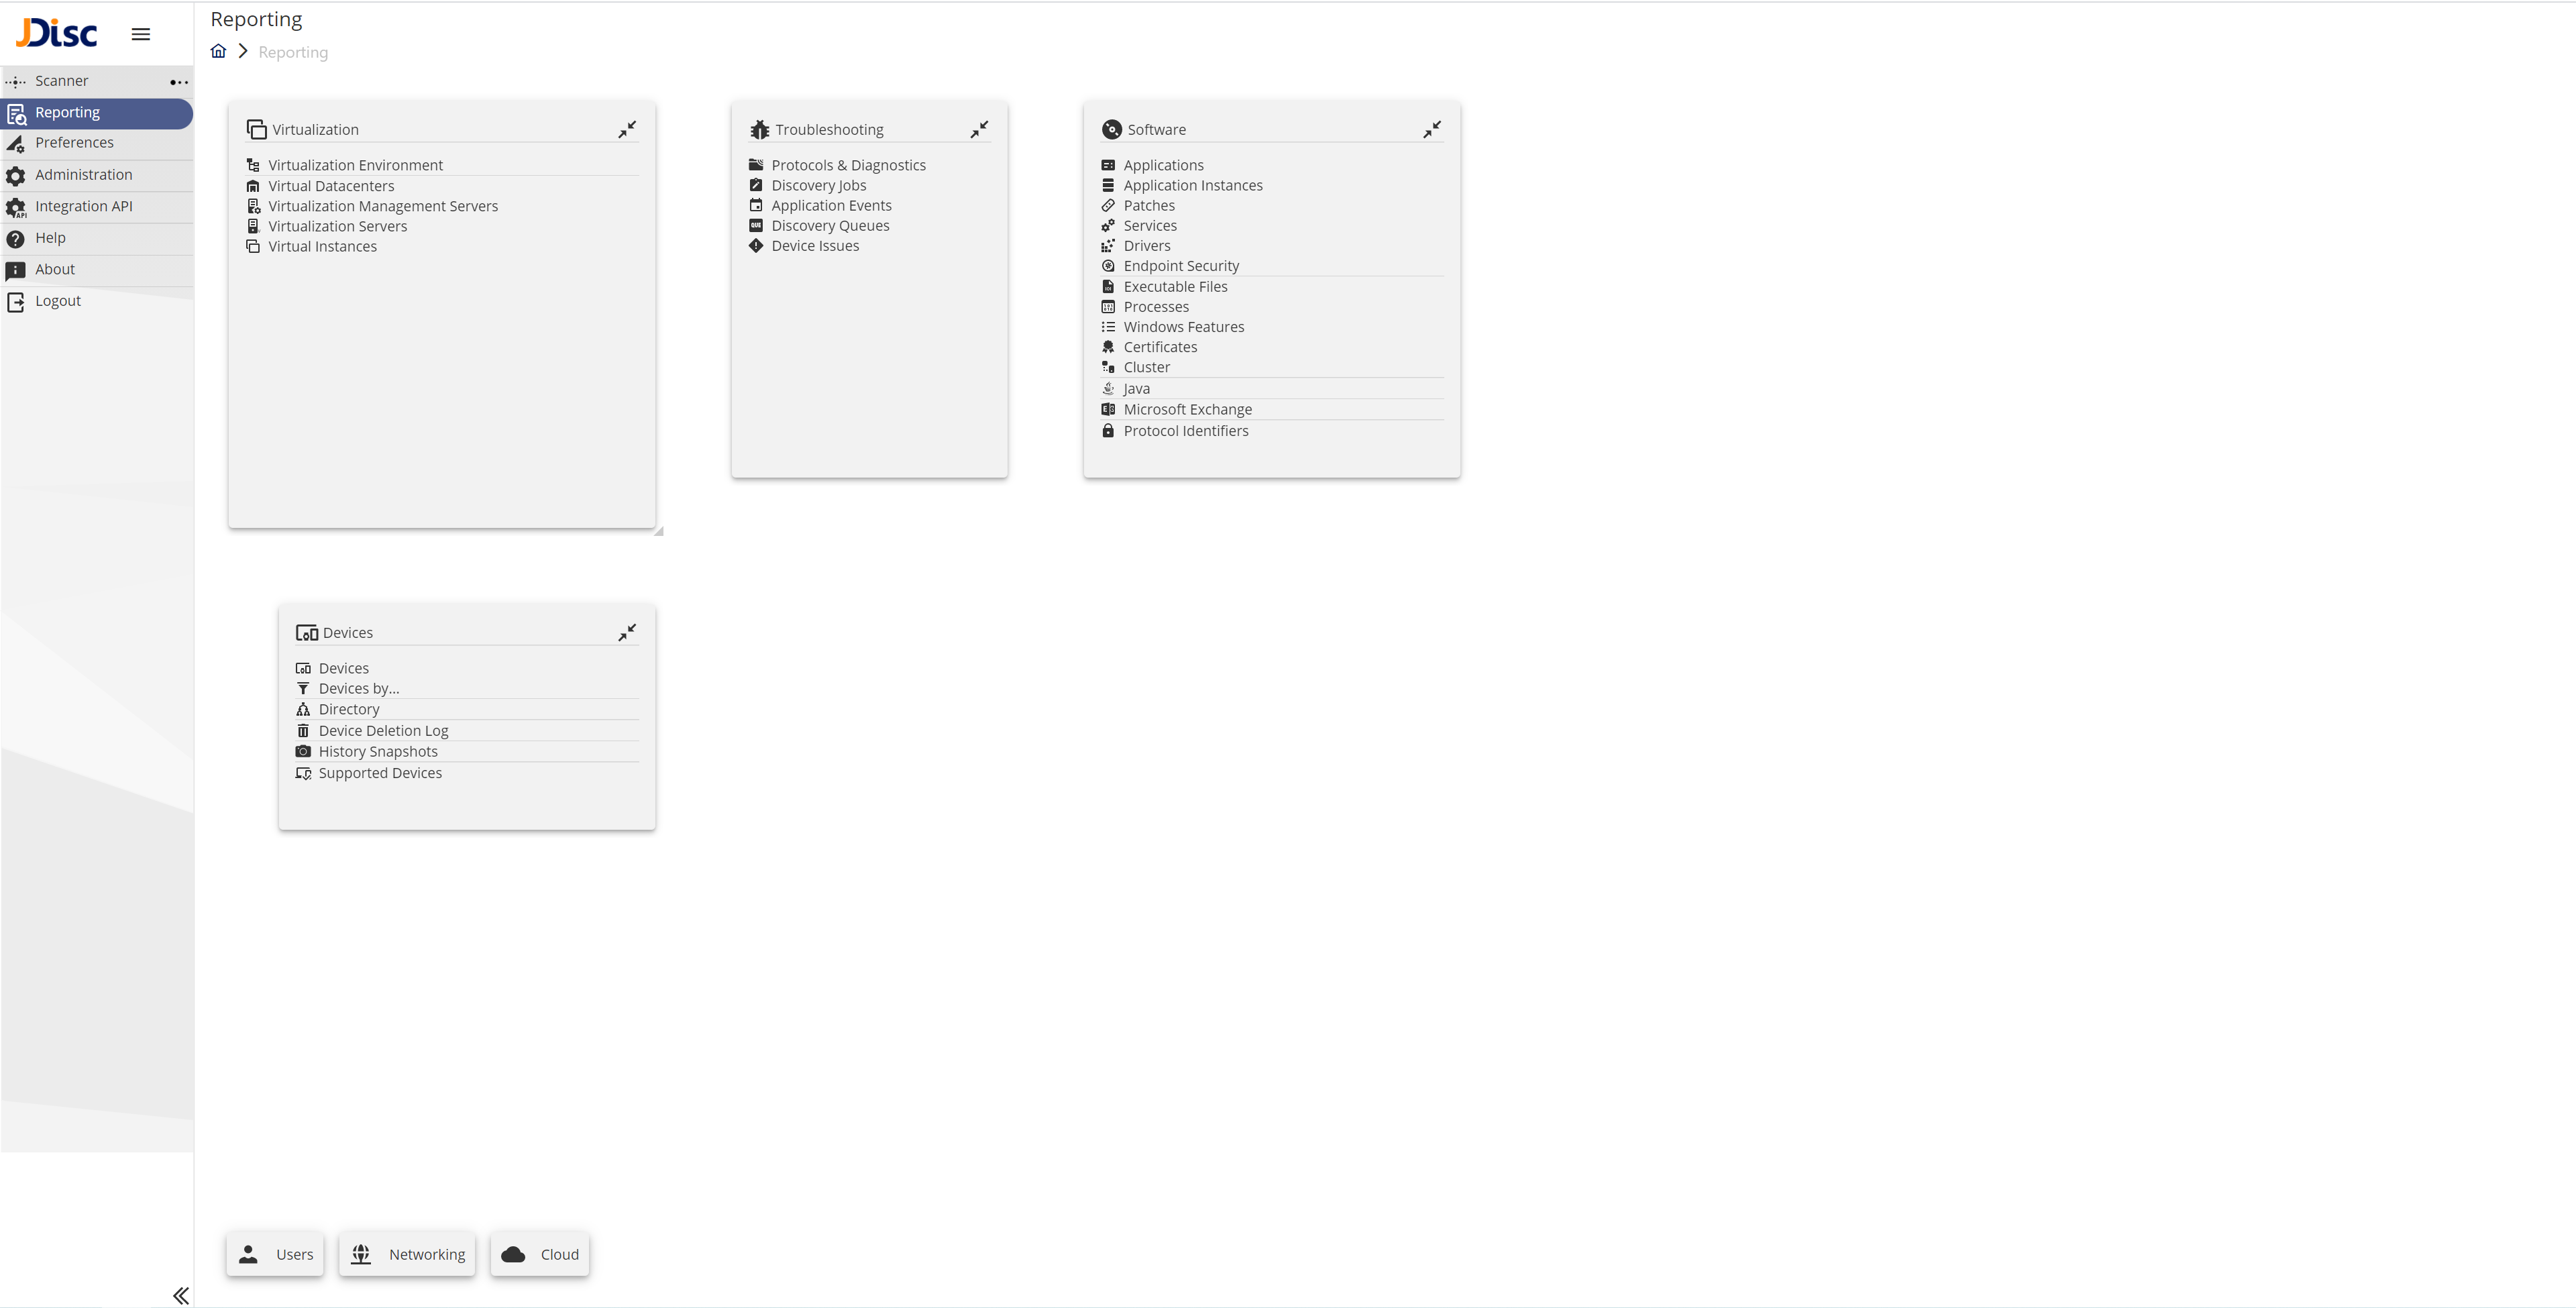
image-6-1 reporting dashboard
Reporting Dashboard

Next Stop

We will continue to work on this component, introducing new features like controlling directly the discovery jobs, getting detailed information of the discovery process, manually triggering specific discovery tasks etc. If you would like to give it a try, just download JDisc Discovery 5.0.

Are you missing something or you would like to suggest something new? We are always looking forward to getting your feedback and ideas. Please share them in our Slack channel or just drop us an email.

Stay tuned for more exciting new features.

Cheers,
Sotiris & Pedram

author avatar
Sotiris Zdragkas
I am software engineer at JDisc, working primarily on the design and implementation of the new Web UI. Before I started at JDisc, I have been developing software for complex and distributed systems for many years in the automotive industry. Feel free to contact me on LinkedIn.

About The Author

Sotiris Zdragkas
I am software engineer at JDisc, working primarily on the design and implementation of the new Web UI. Before I started at JDisc, I have been developing software for complex and distributed systems for many years in the automotive industry. Feel free to contact me on LinkedIn.

Leave A Comment


The reCAPTCHA verification period has expired. Please reload the page.