Getting ready for the Cloud with our Measurement Add-On

you might have noticed in our release notes that we are working on a measurement add-on. The measurement add-on will collect measurement data such as CPU load, disk io, network io etc. from servers, printed pages and toner/ink usage from printers, power consumption from PDUs, and environment information such as temperature or humidity from sensor devices. The development for this add-on comes to the final phase where we are adding graphing and special reports aggregating the data over time.
One of the popular use case for collecting such data is preparing cloud migrations. You need two different kind of information to decide whether you can migrate a server to the cloud or not and if yes, what plan you would need to subscribe to:
- Inventory information such as hardware and software configuration
- Utilization data (such as cpu load, disk io, network io, …).
Our new – currently under development – measurement add-on gets performance data from Windows computers by configuring the built-in Windows Perfmon to track performance data locally. JDisc Discovery collects the log files periodically and stores the counter values in our database. Special reports can create hourly, daily, weekly, monthly and quarterly statistics including min/max and average values. And of course, you can also review the raw data.
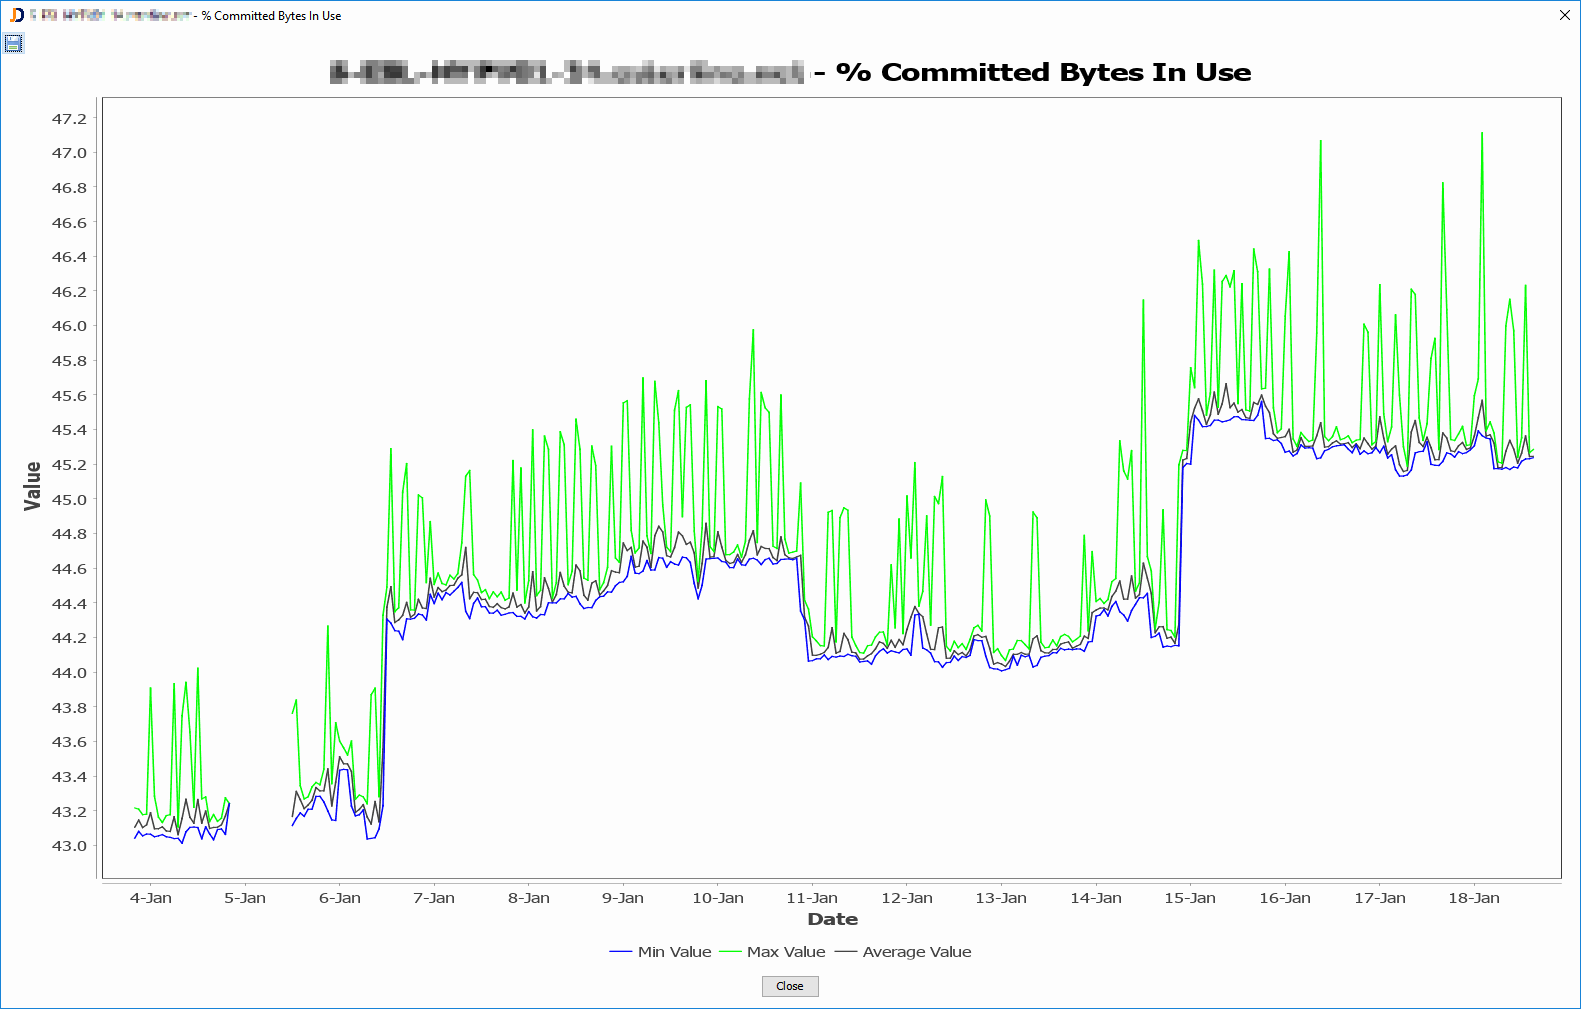
The following report displays the hourly statistics including min, max and average value for the “% committed bytes in use” counter for a specific server over time.
Create a chart by clicking on the line chart icon within the toolbar. The line chart includes the min, max, and average value for the selected counter.
We expect to release the add-on in summer this year. Feel free to send us comments or suggestions of what you would like to see or expect in this add-on.
Looking forward to release this new add-on…
Cheers,
Thomas


