JDisc Discovery Web UI: Scanner new features & updates
Scanner_featured

Dear JDisc friends,

It has been a long time since the last update on the progress of our new JDisc Discovery Web UI. However, this does not mean that we paused working on it. On the contrary, you may have already noticed – if you are following our release notes or if you are subscribed to our newsletter – that during the past weeks, we intensified our Web UI development and delivered a number of new features and UI improvements. As always, the features are delivered continuously within our weekly or bi-weekly software releases.

Let’s have a look at the new features.

1. Feature Discover Device

Sometimes you just need to trigger a scan for specific IPs or Hostnames. Right on the Scanner action menu, find and select the Discover Device menu item. (Figure 1.1)

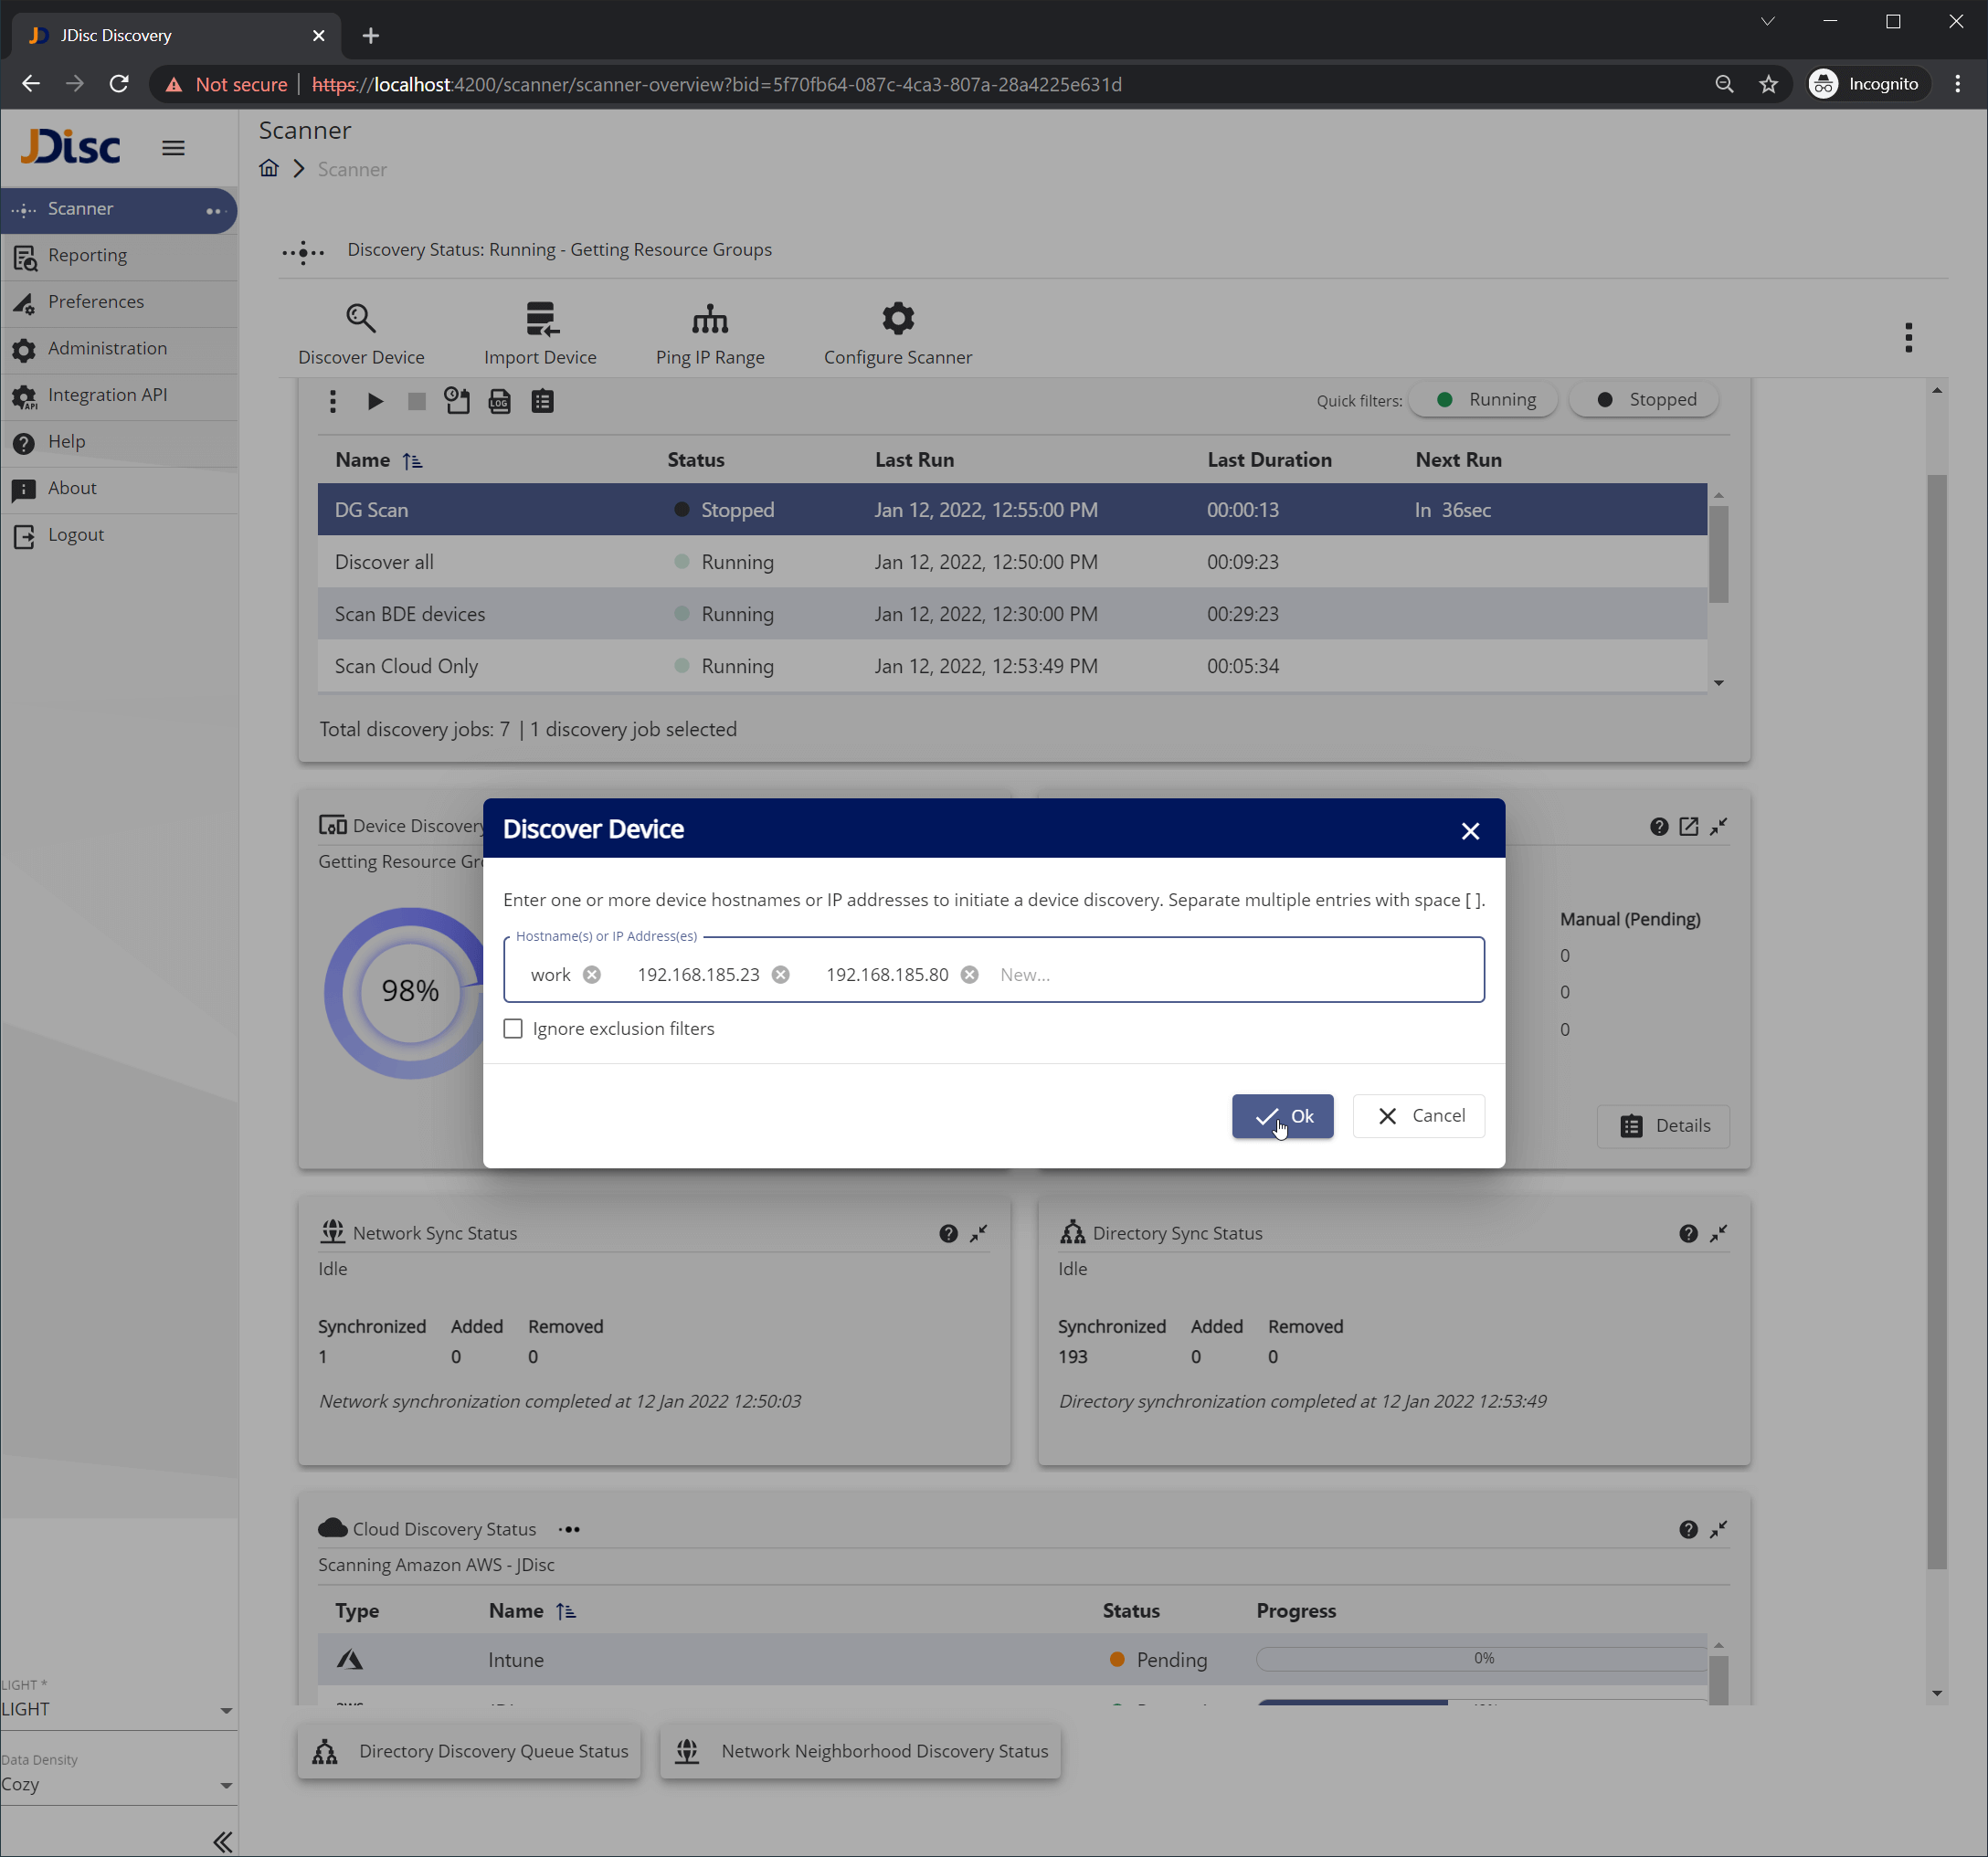
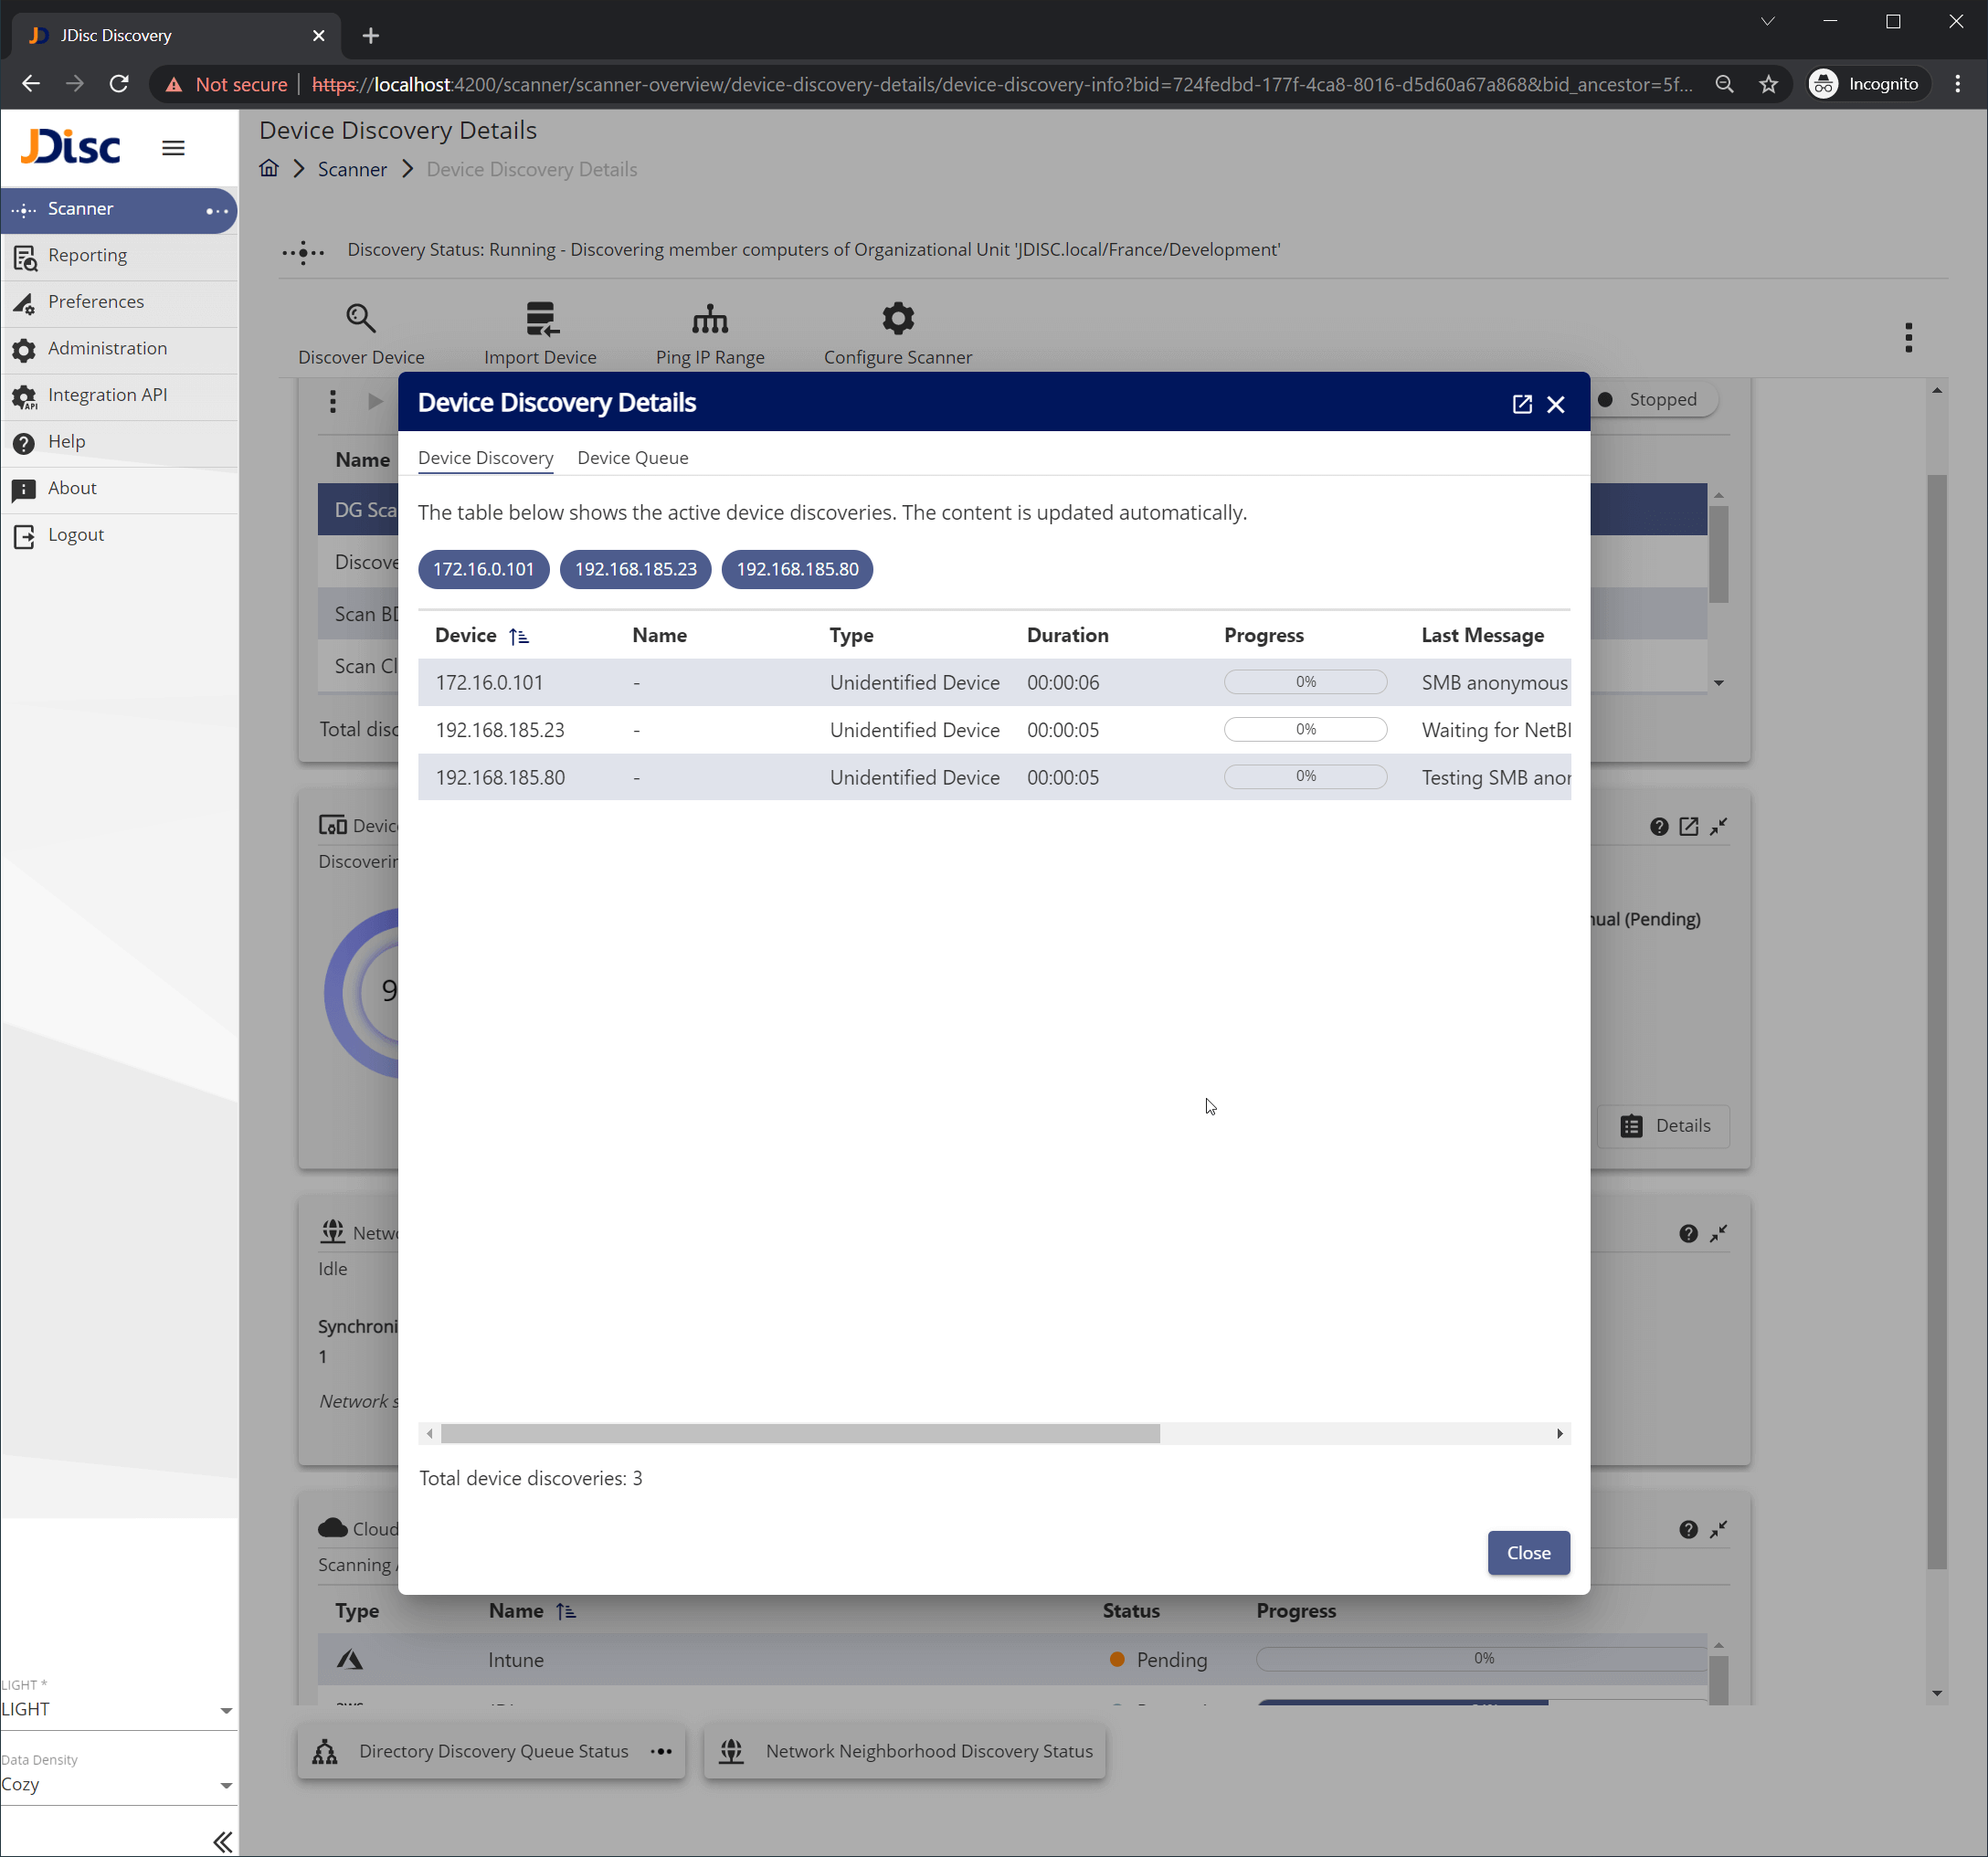
An input dialog (Figure 1.2) will appear which allows you to enter in a convenient way all these IPs or Hostnames that you would like to scan. When you are done with the input, just hit Ok. A new dialog will pop-up (Figure 1.3) which will show you the device discovery status of those IPs or Hostnames that you have entered.

Figure-1.1-3 Discover Device action menu item
Figure 1.1 – Discover Device action menu item
Figure-1.2-2 Discover Device input
Figure 1.2 – Discover Device input
Figure-1.3-2 Device Discovery Details
Figure 1.3 – Device Discovery Details

2. Feature Discovery Job controls

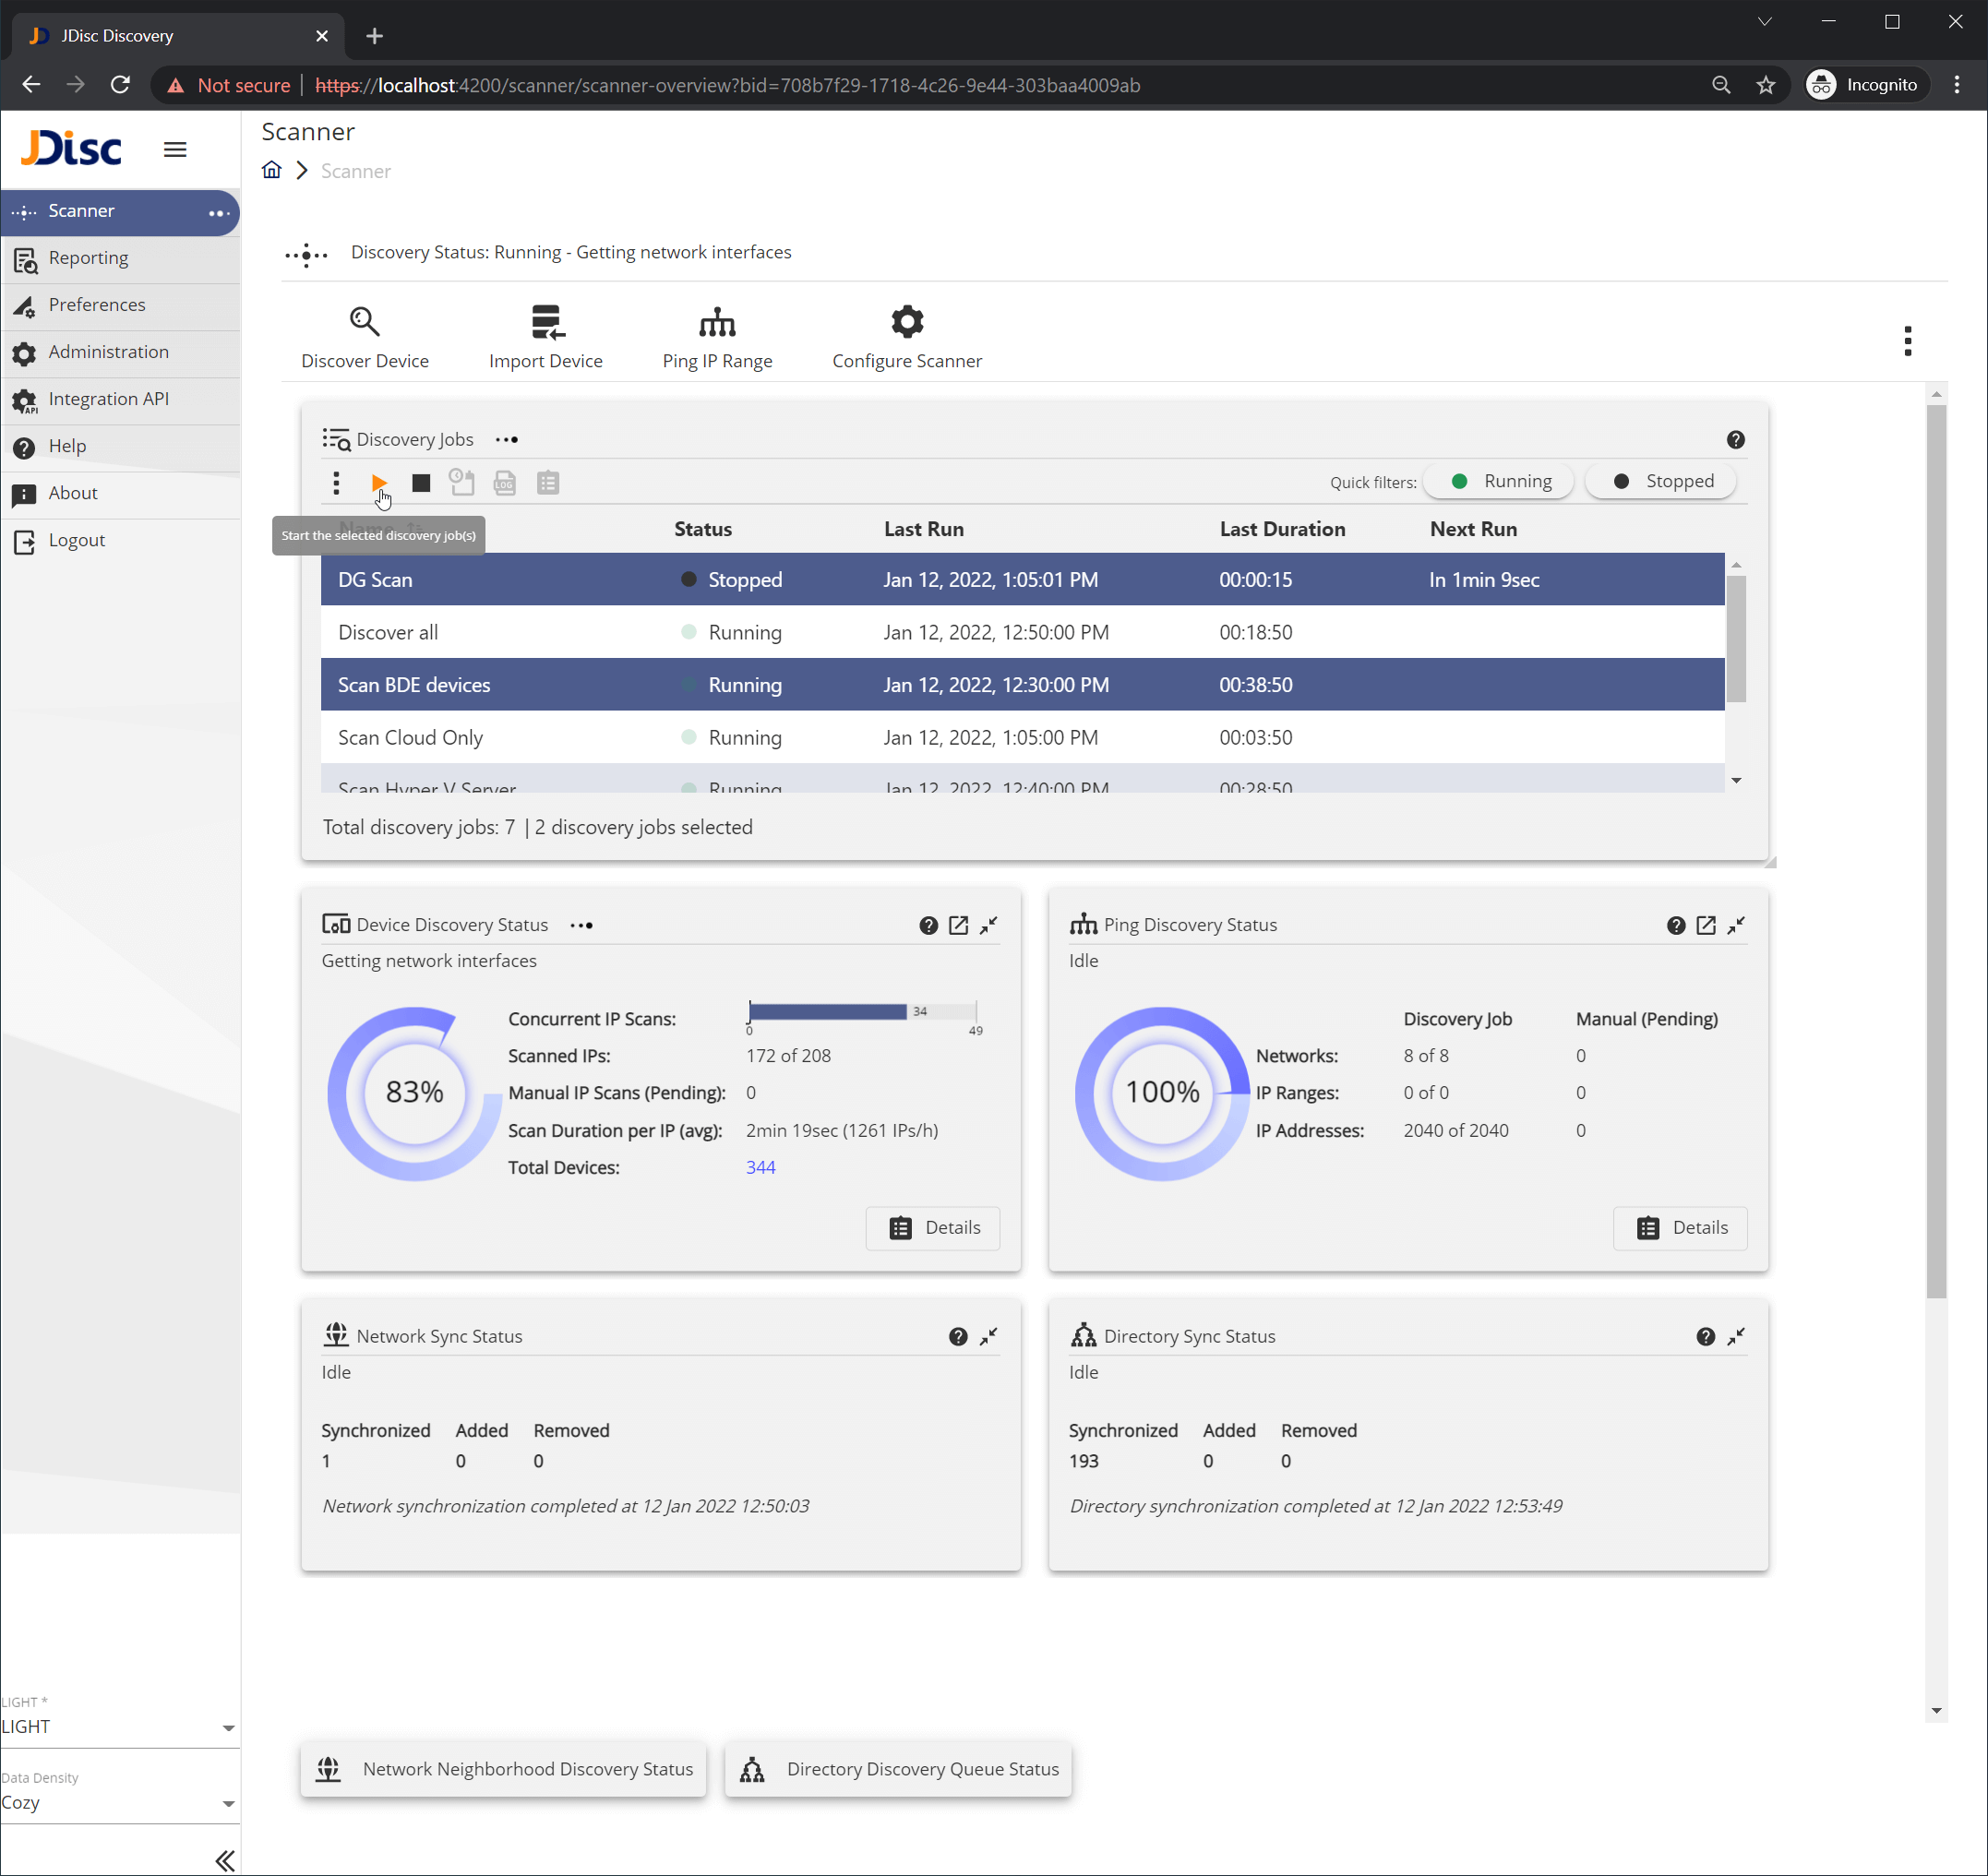
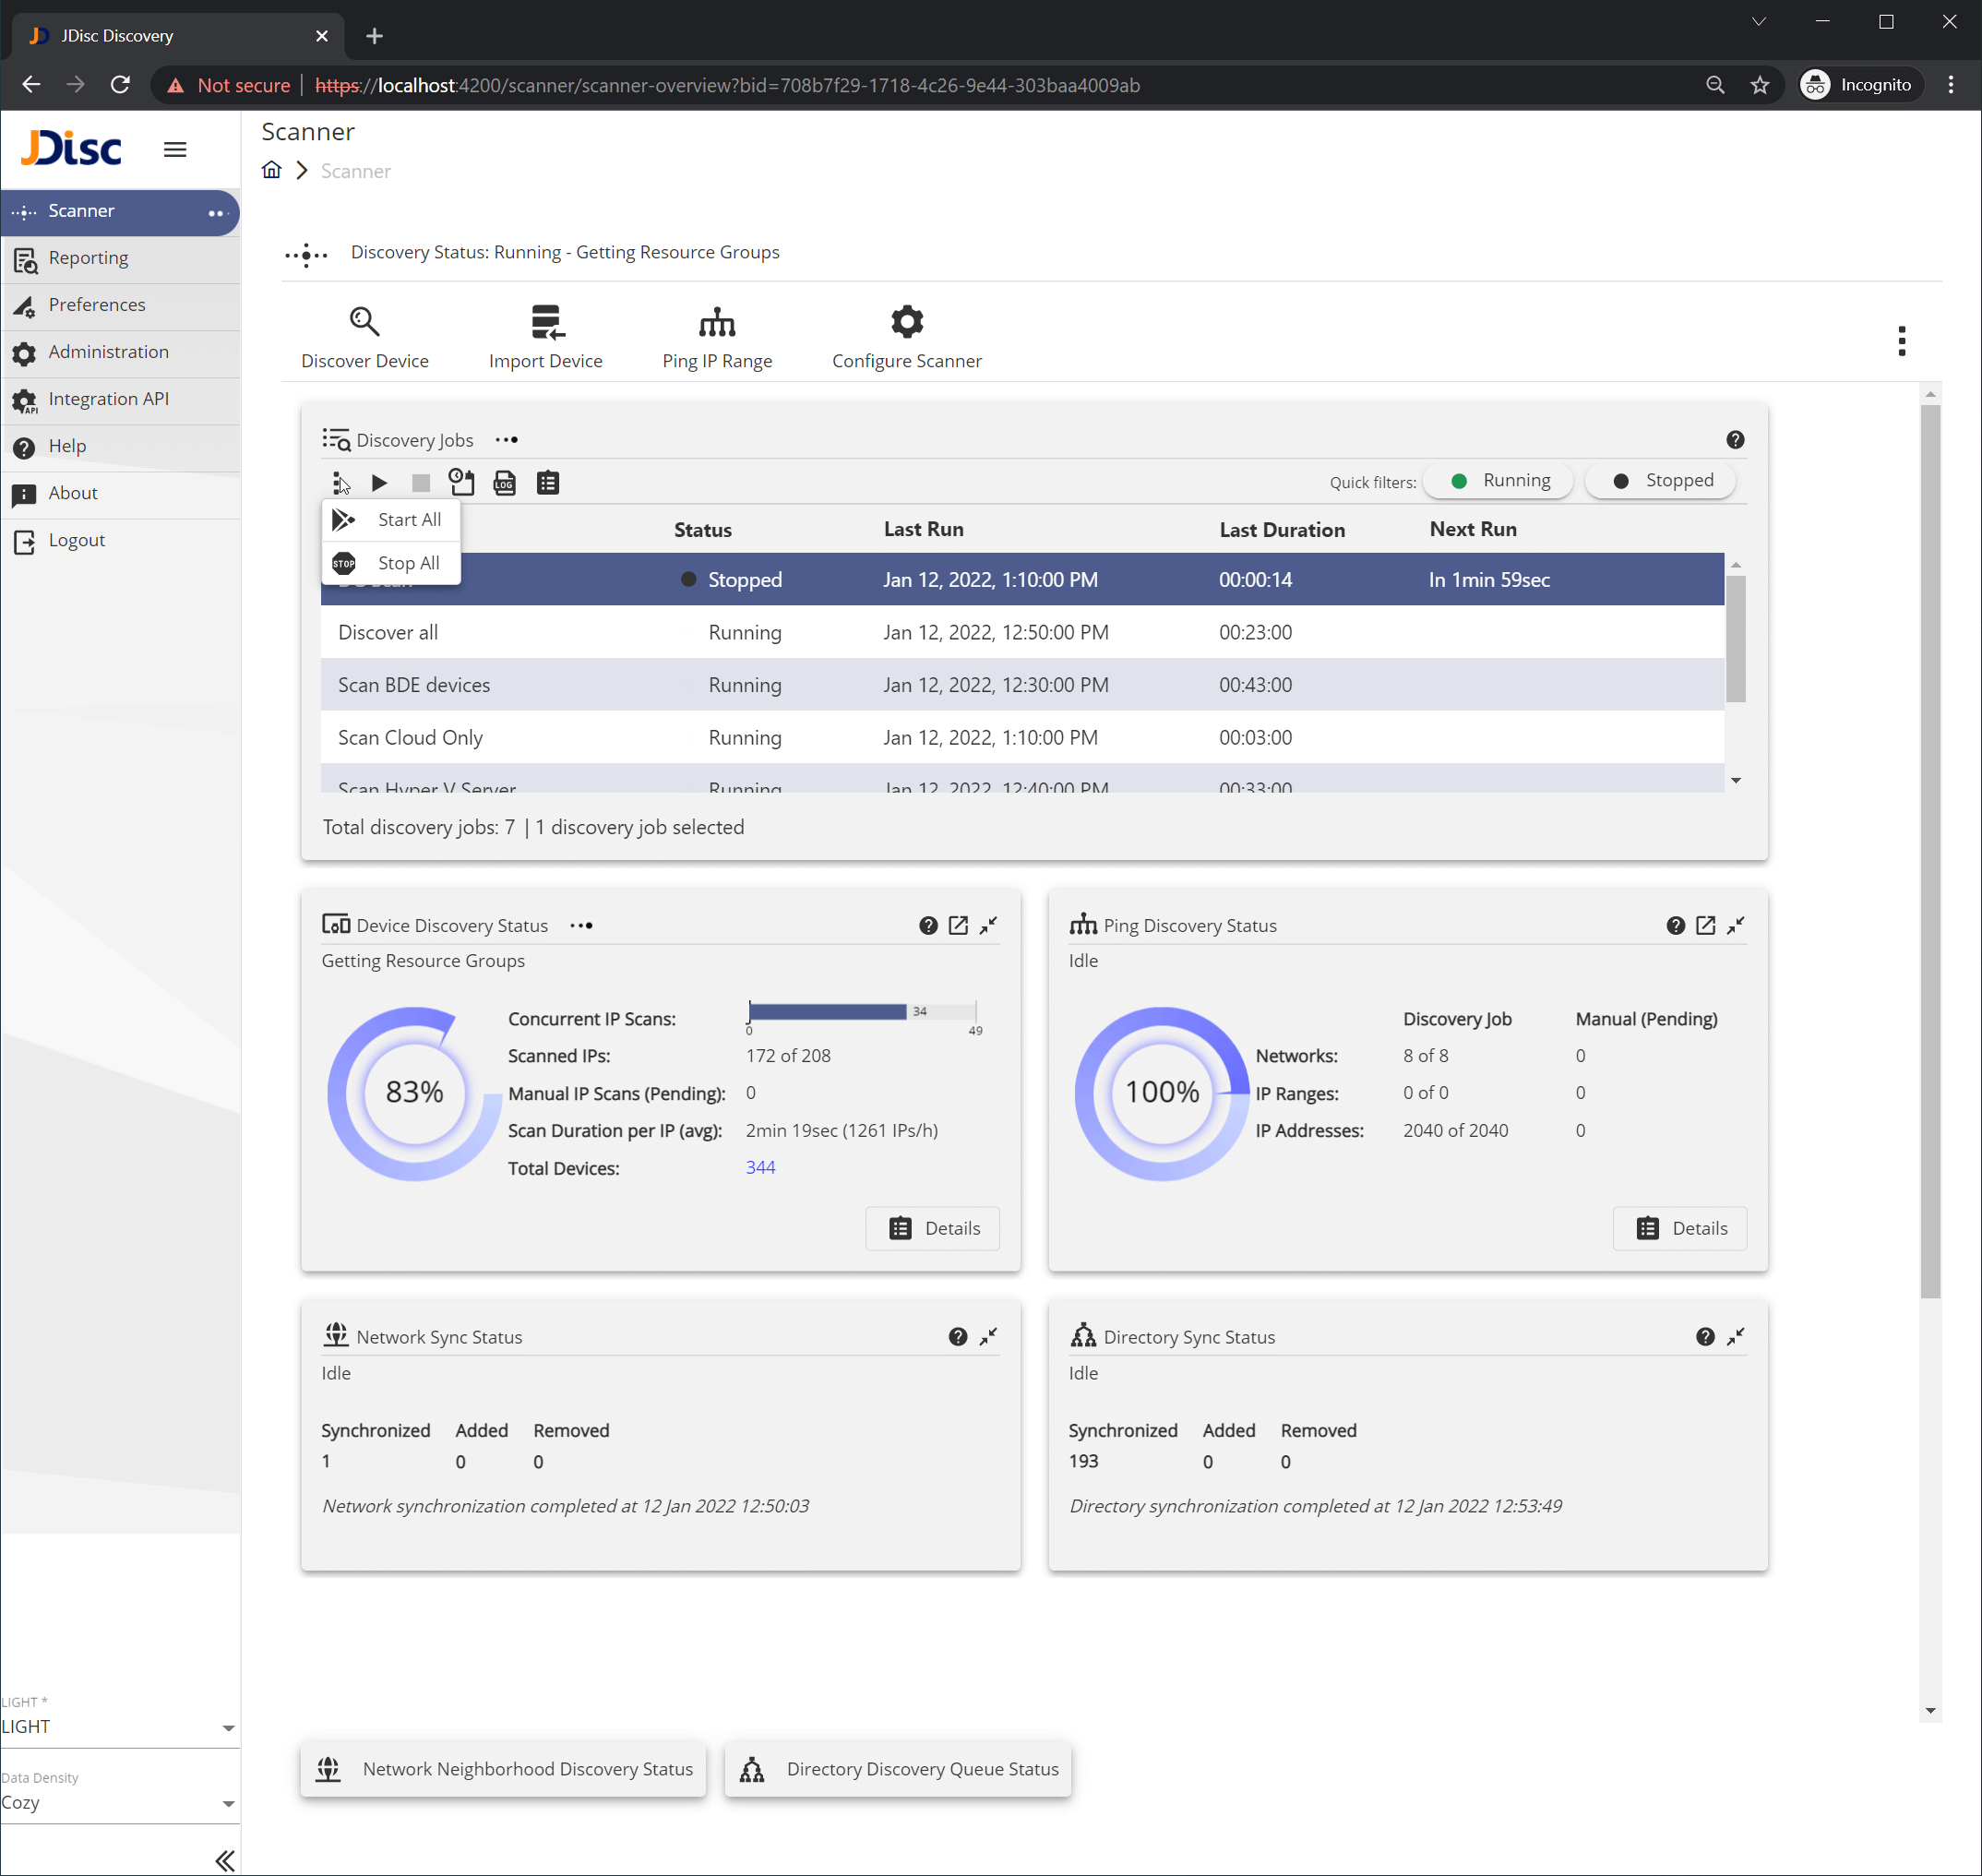
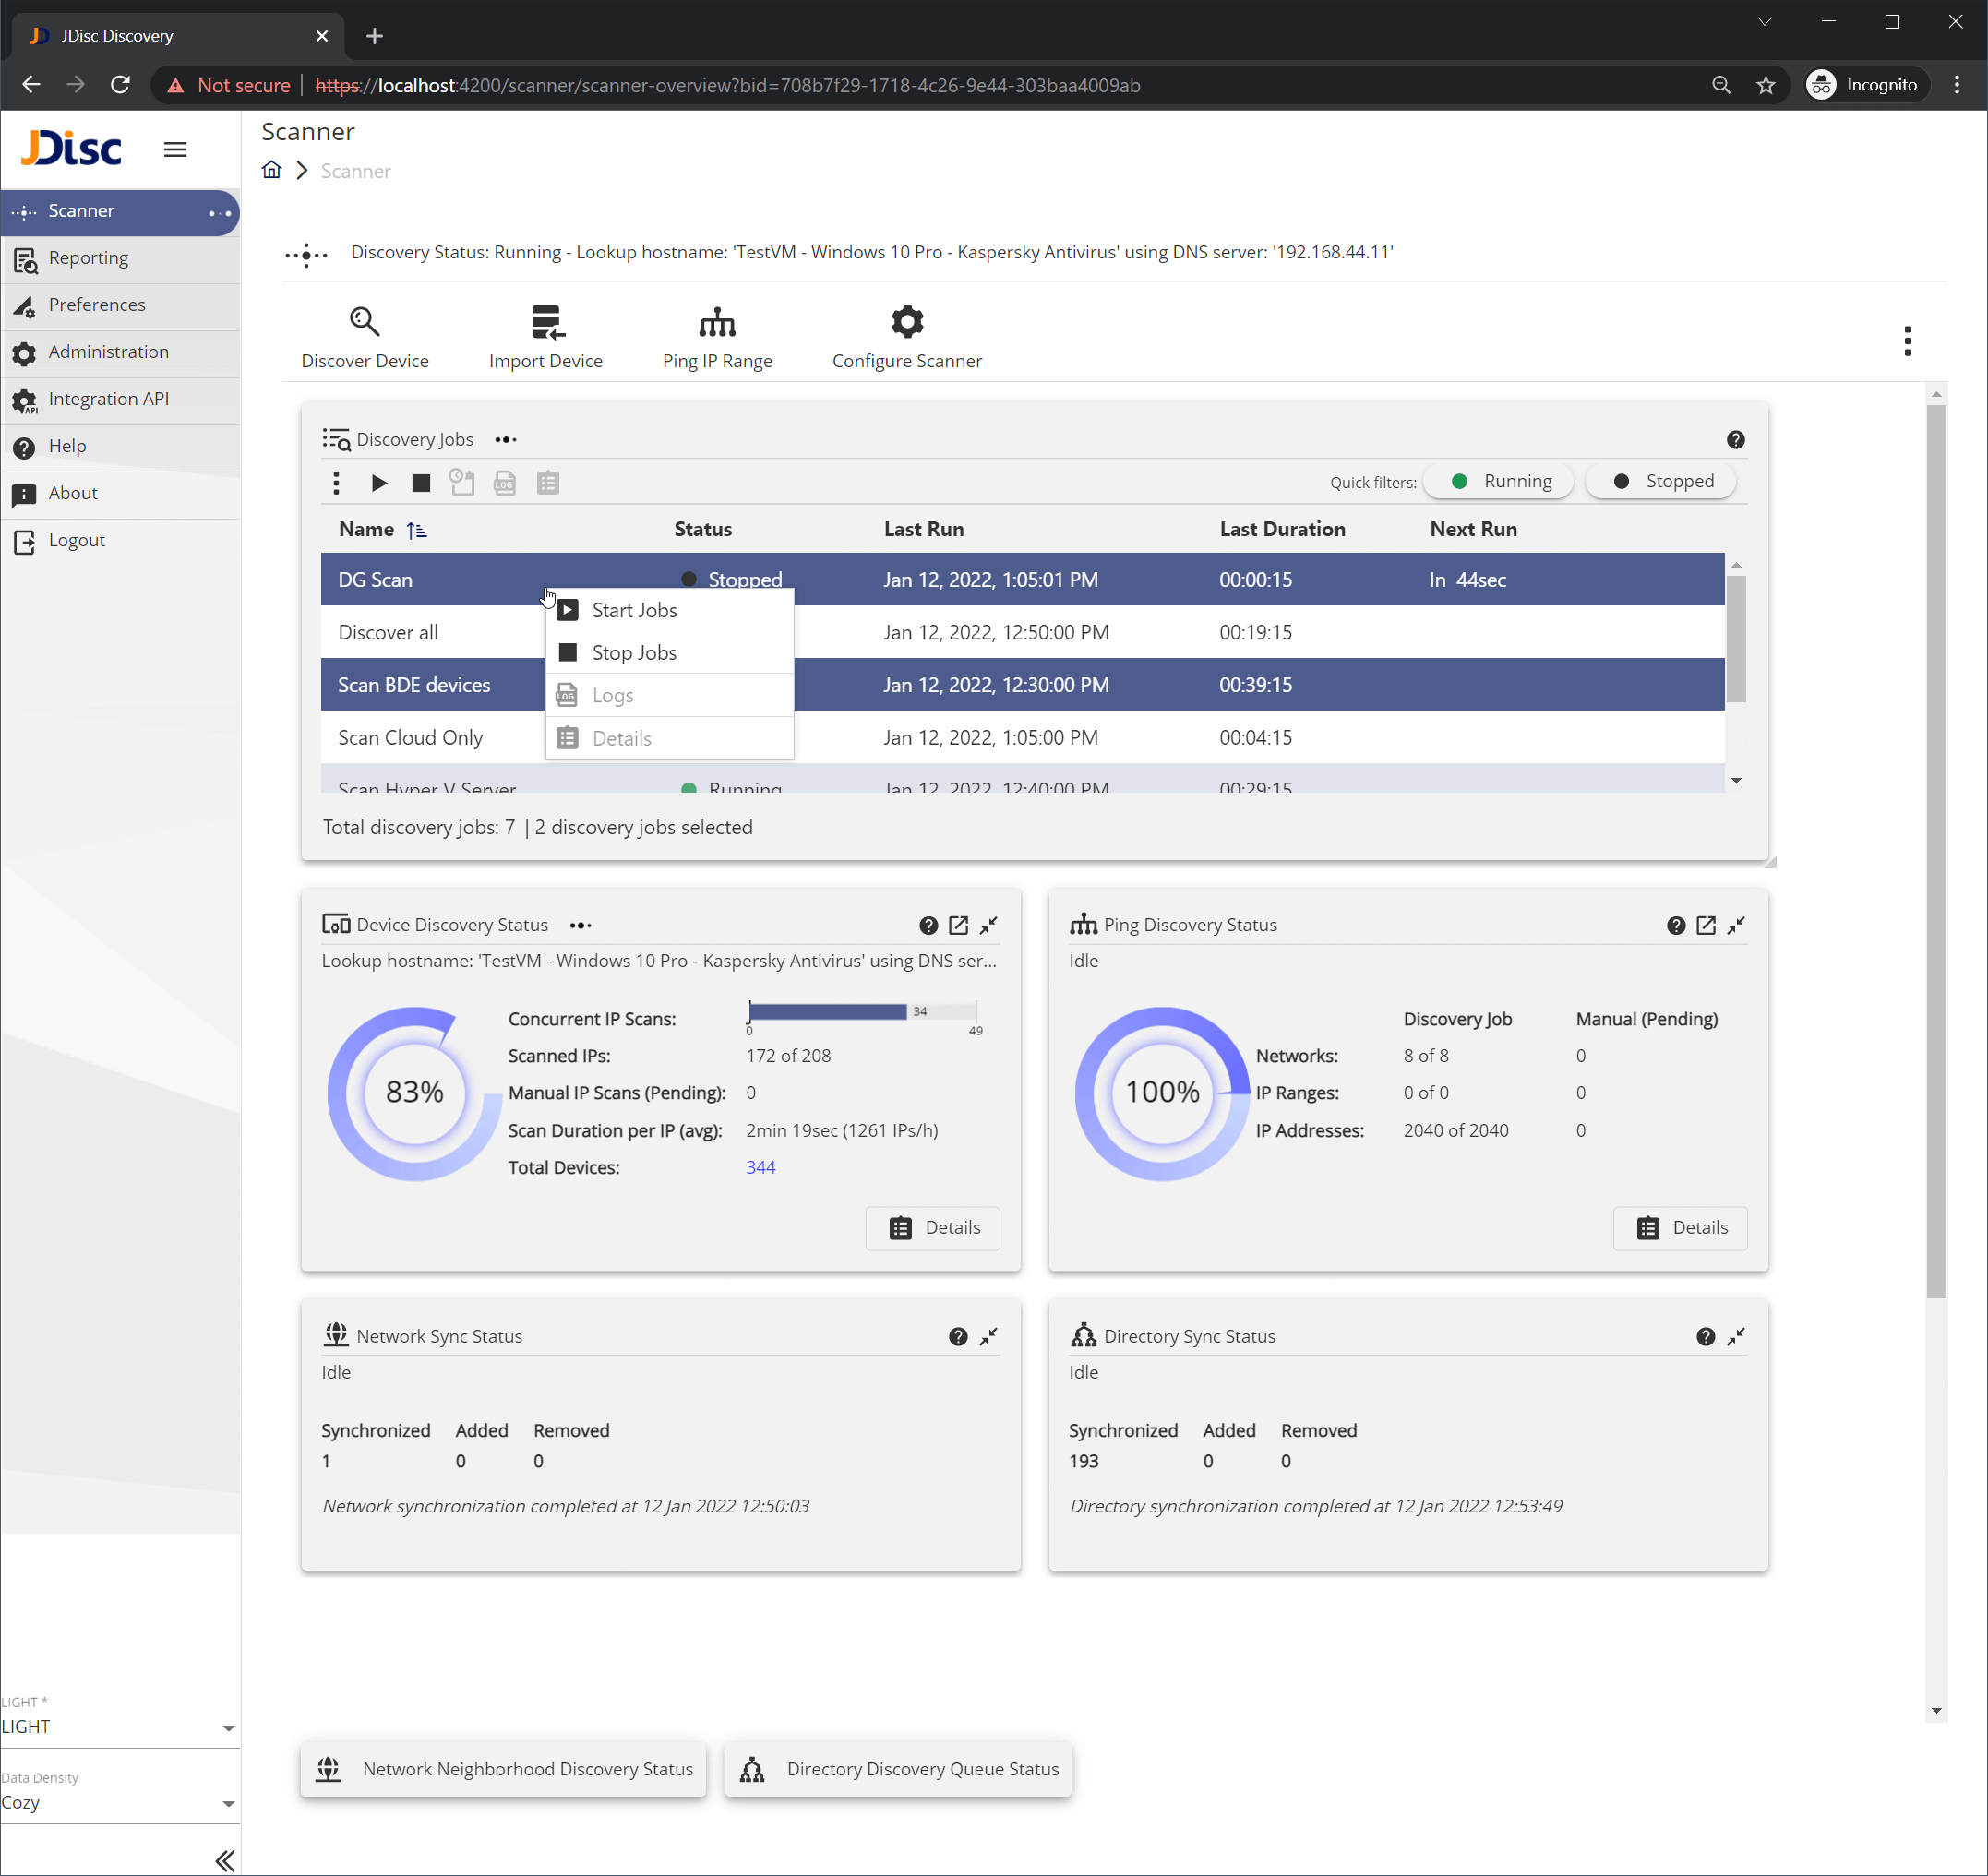
This feature allows you to start or stop one or more discovery jobs. In order to do so, just select the job(s) and select the preferred action from the toolbar (Figure 2.1) or from the context menu (Figure 2.3). You can also start or stop all jobs (Figure 2.2).

Figure-2.1-1 Discovery Job toolbar menu
Figure 2.1 – Discovery Job toolbar menu
Figure-2.2-1 Discovery Job bulk actions
Figure 2.2 – Discovery Job bulk actions
Figure-2.3-1 Discovery Job context menu
Figure 2.3 – Discovery Job context menu

3. Feature View Discovery Job details

The following feature set is centered around the discovery job configuration and troubleshooting. For now, all features are read-only. However, in the near future, we will allow also editing.

3.1 Discovery Job list-detail view, general info & statistics

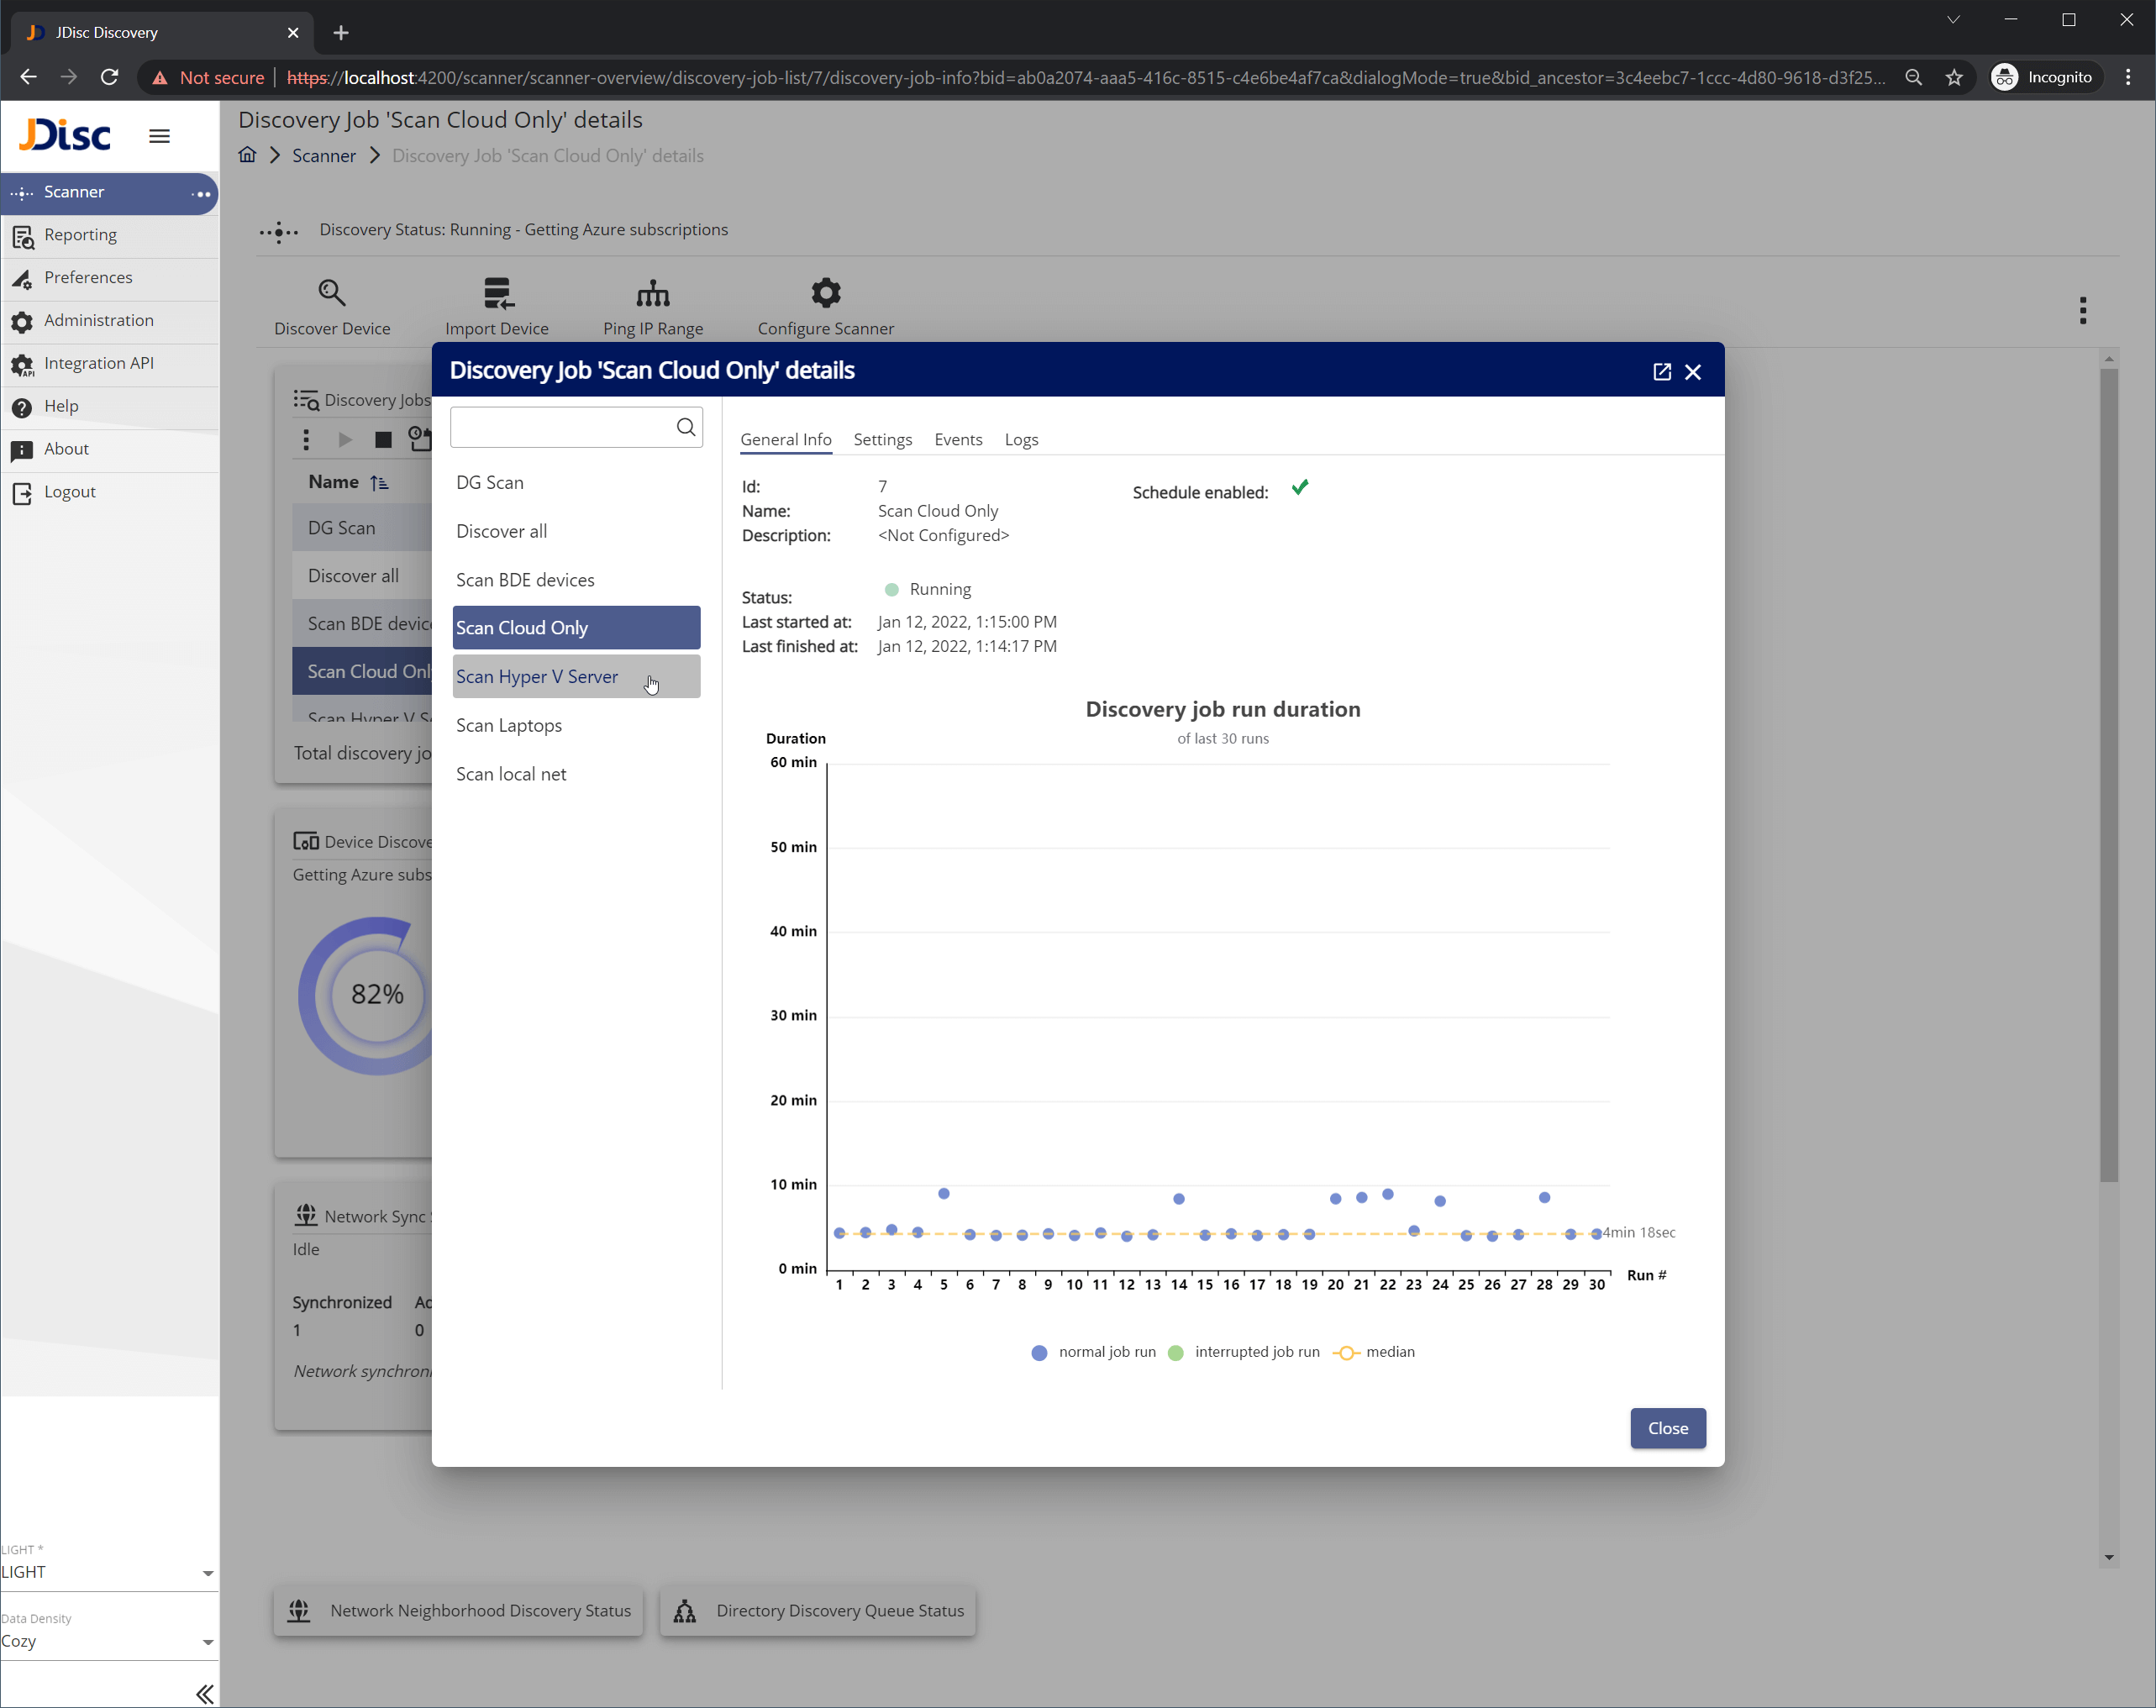
By double-clicking on a discovery job or by selecting the discovery job details icon button from the toolbar, the job details dialog opens (Figure 3.1). On the left side of the dialog, you can see all discovery jobs configured on your environment. You can easily navigate from one job to another by clicking on it. In the same dialog, you can see basic configuration attributes of the selected discovery job, as well as some statistics about the run duration of the last 30 discovery job runs.

Figure-3.1-1 Discovery job details dialog
Figure 3.1 – Discovery job details dialog

3.2 Discovery Job discovery settings & schedule

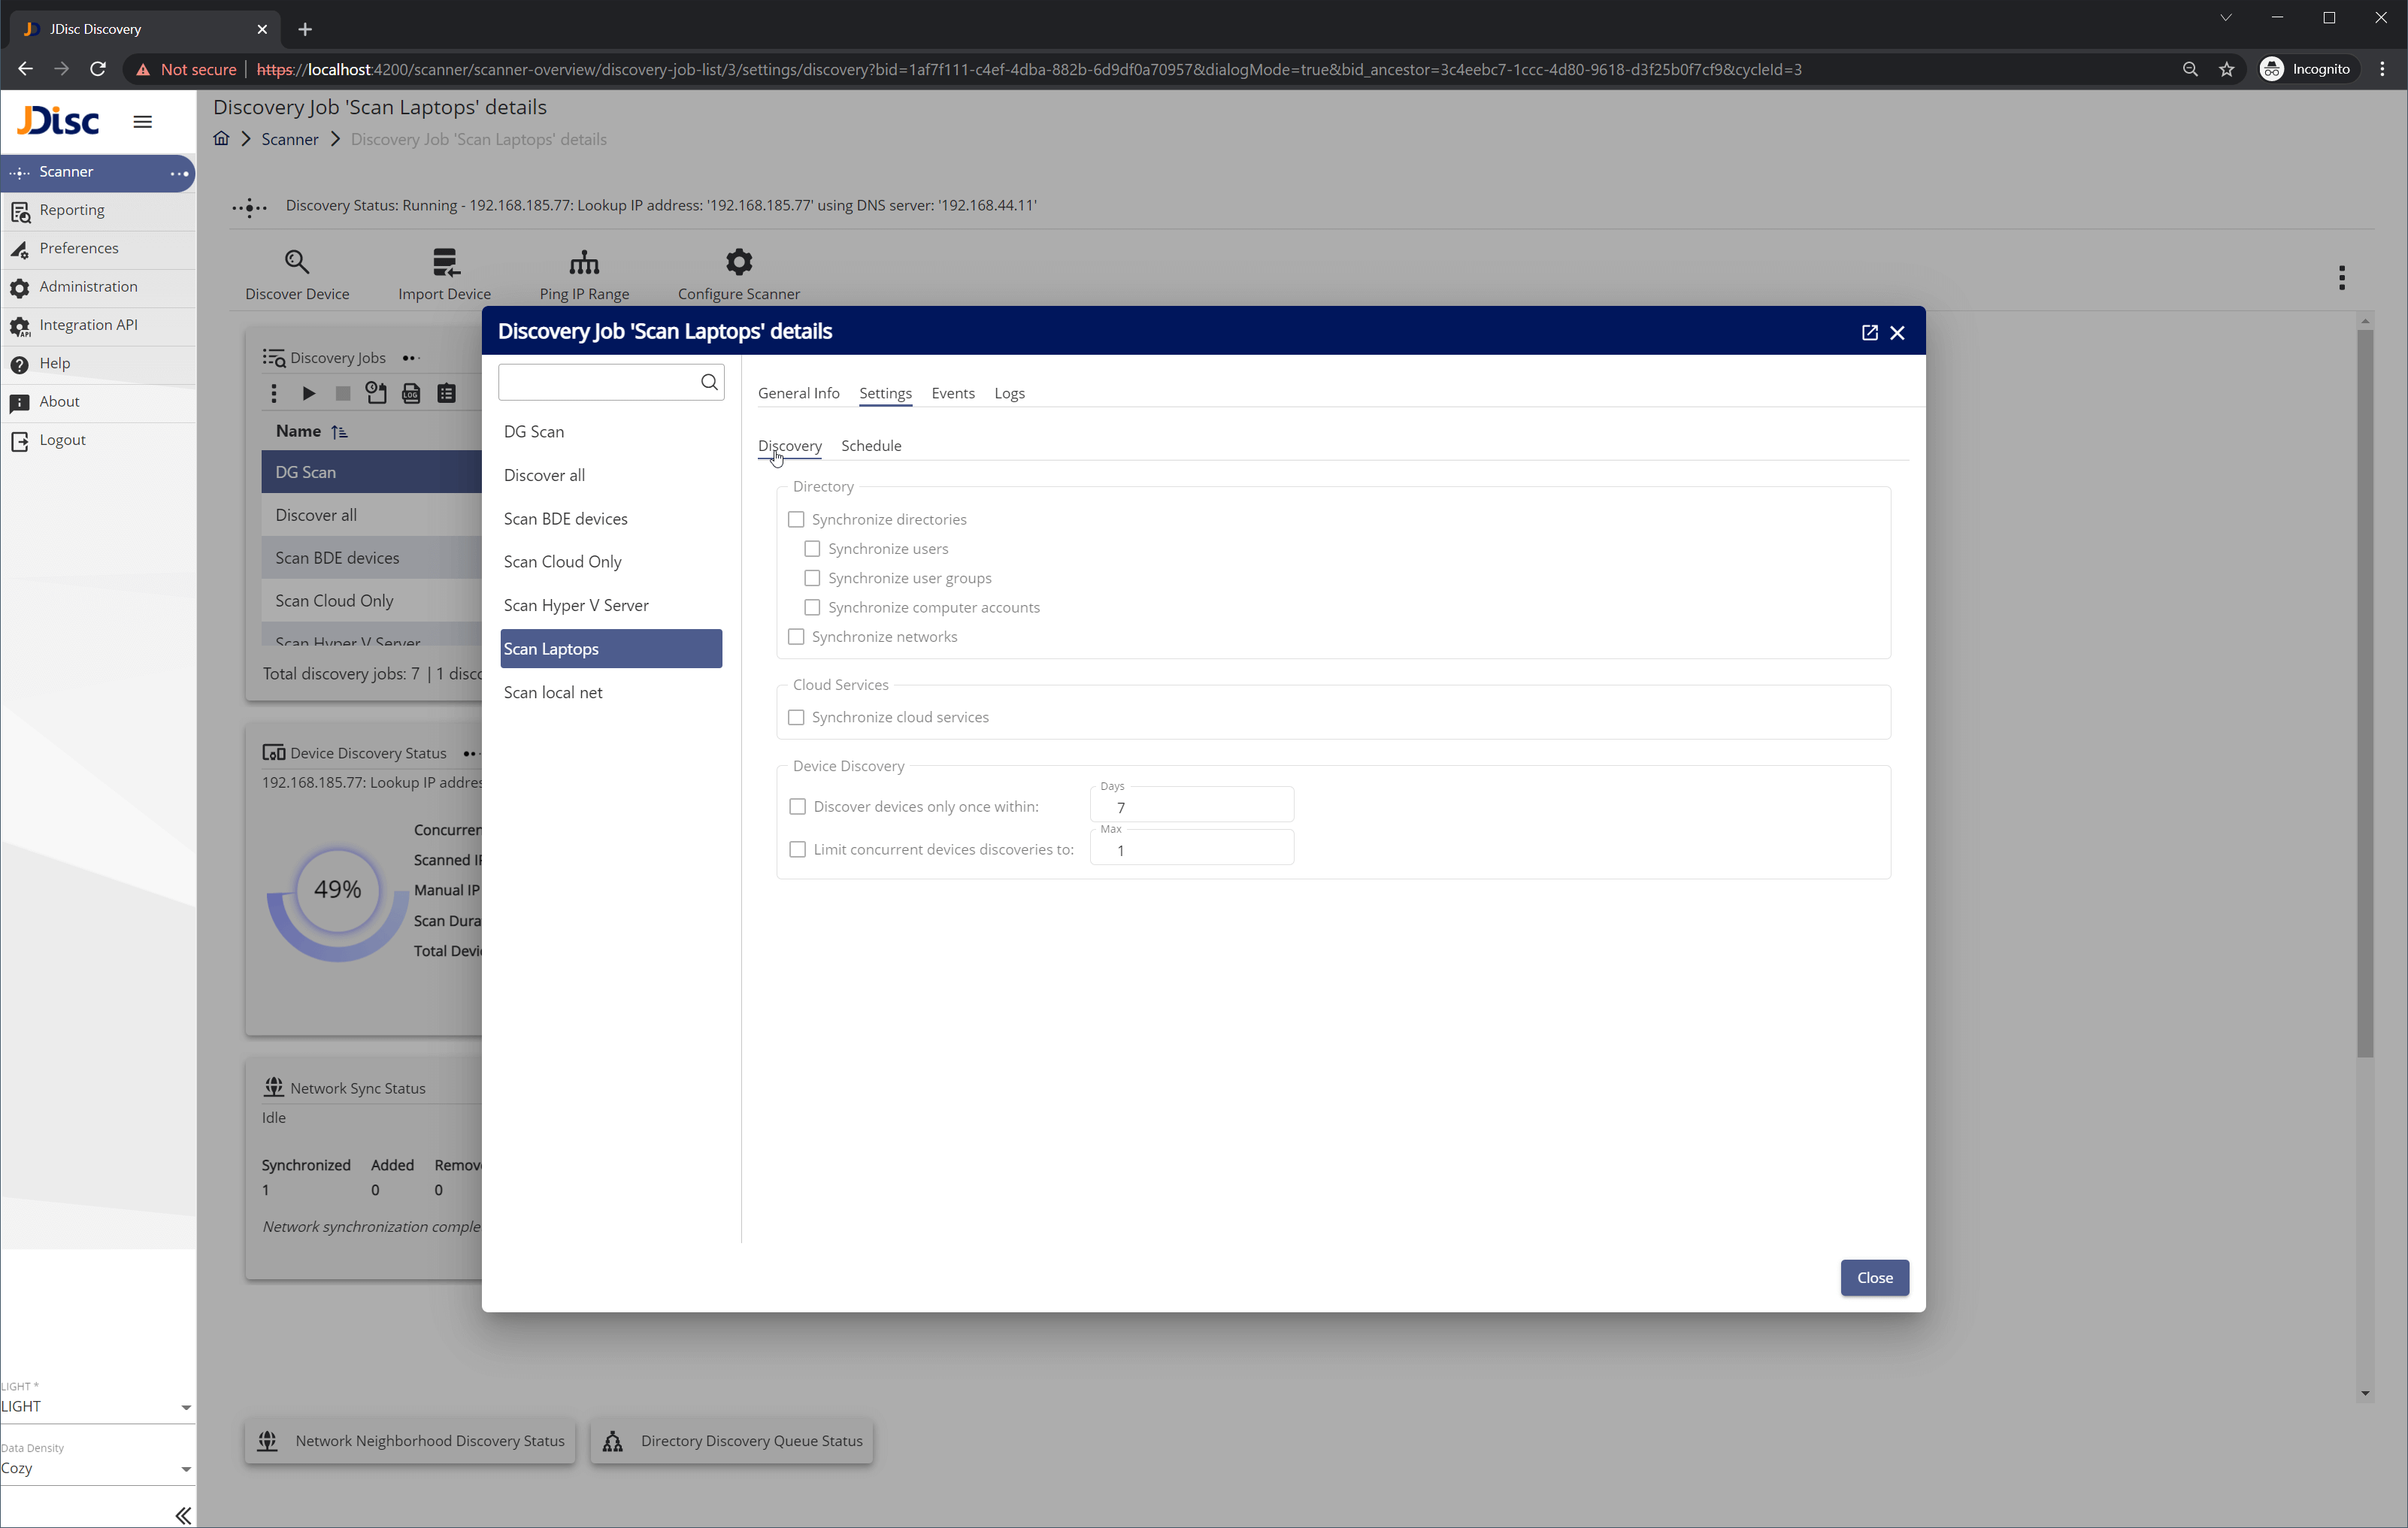
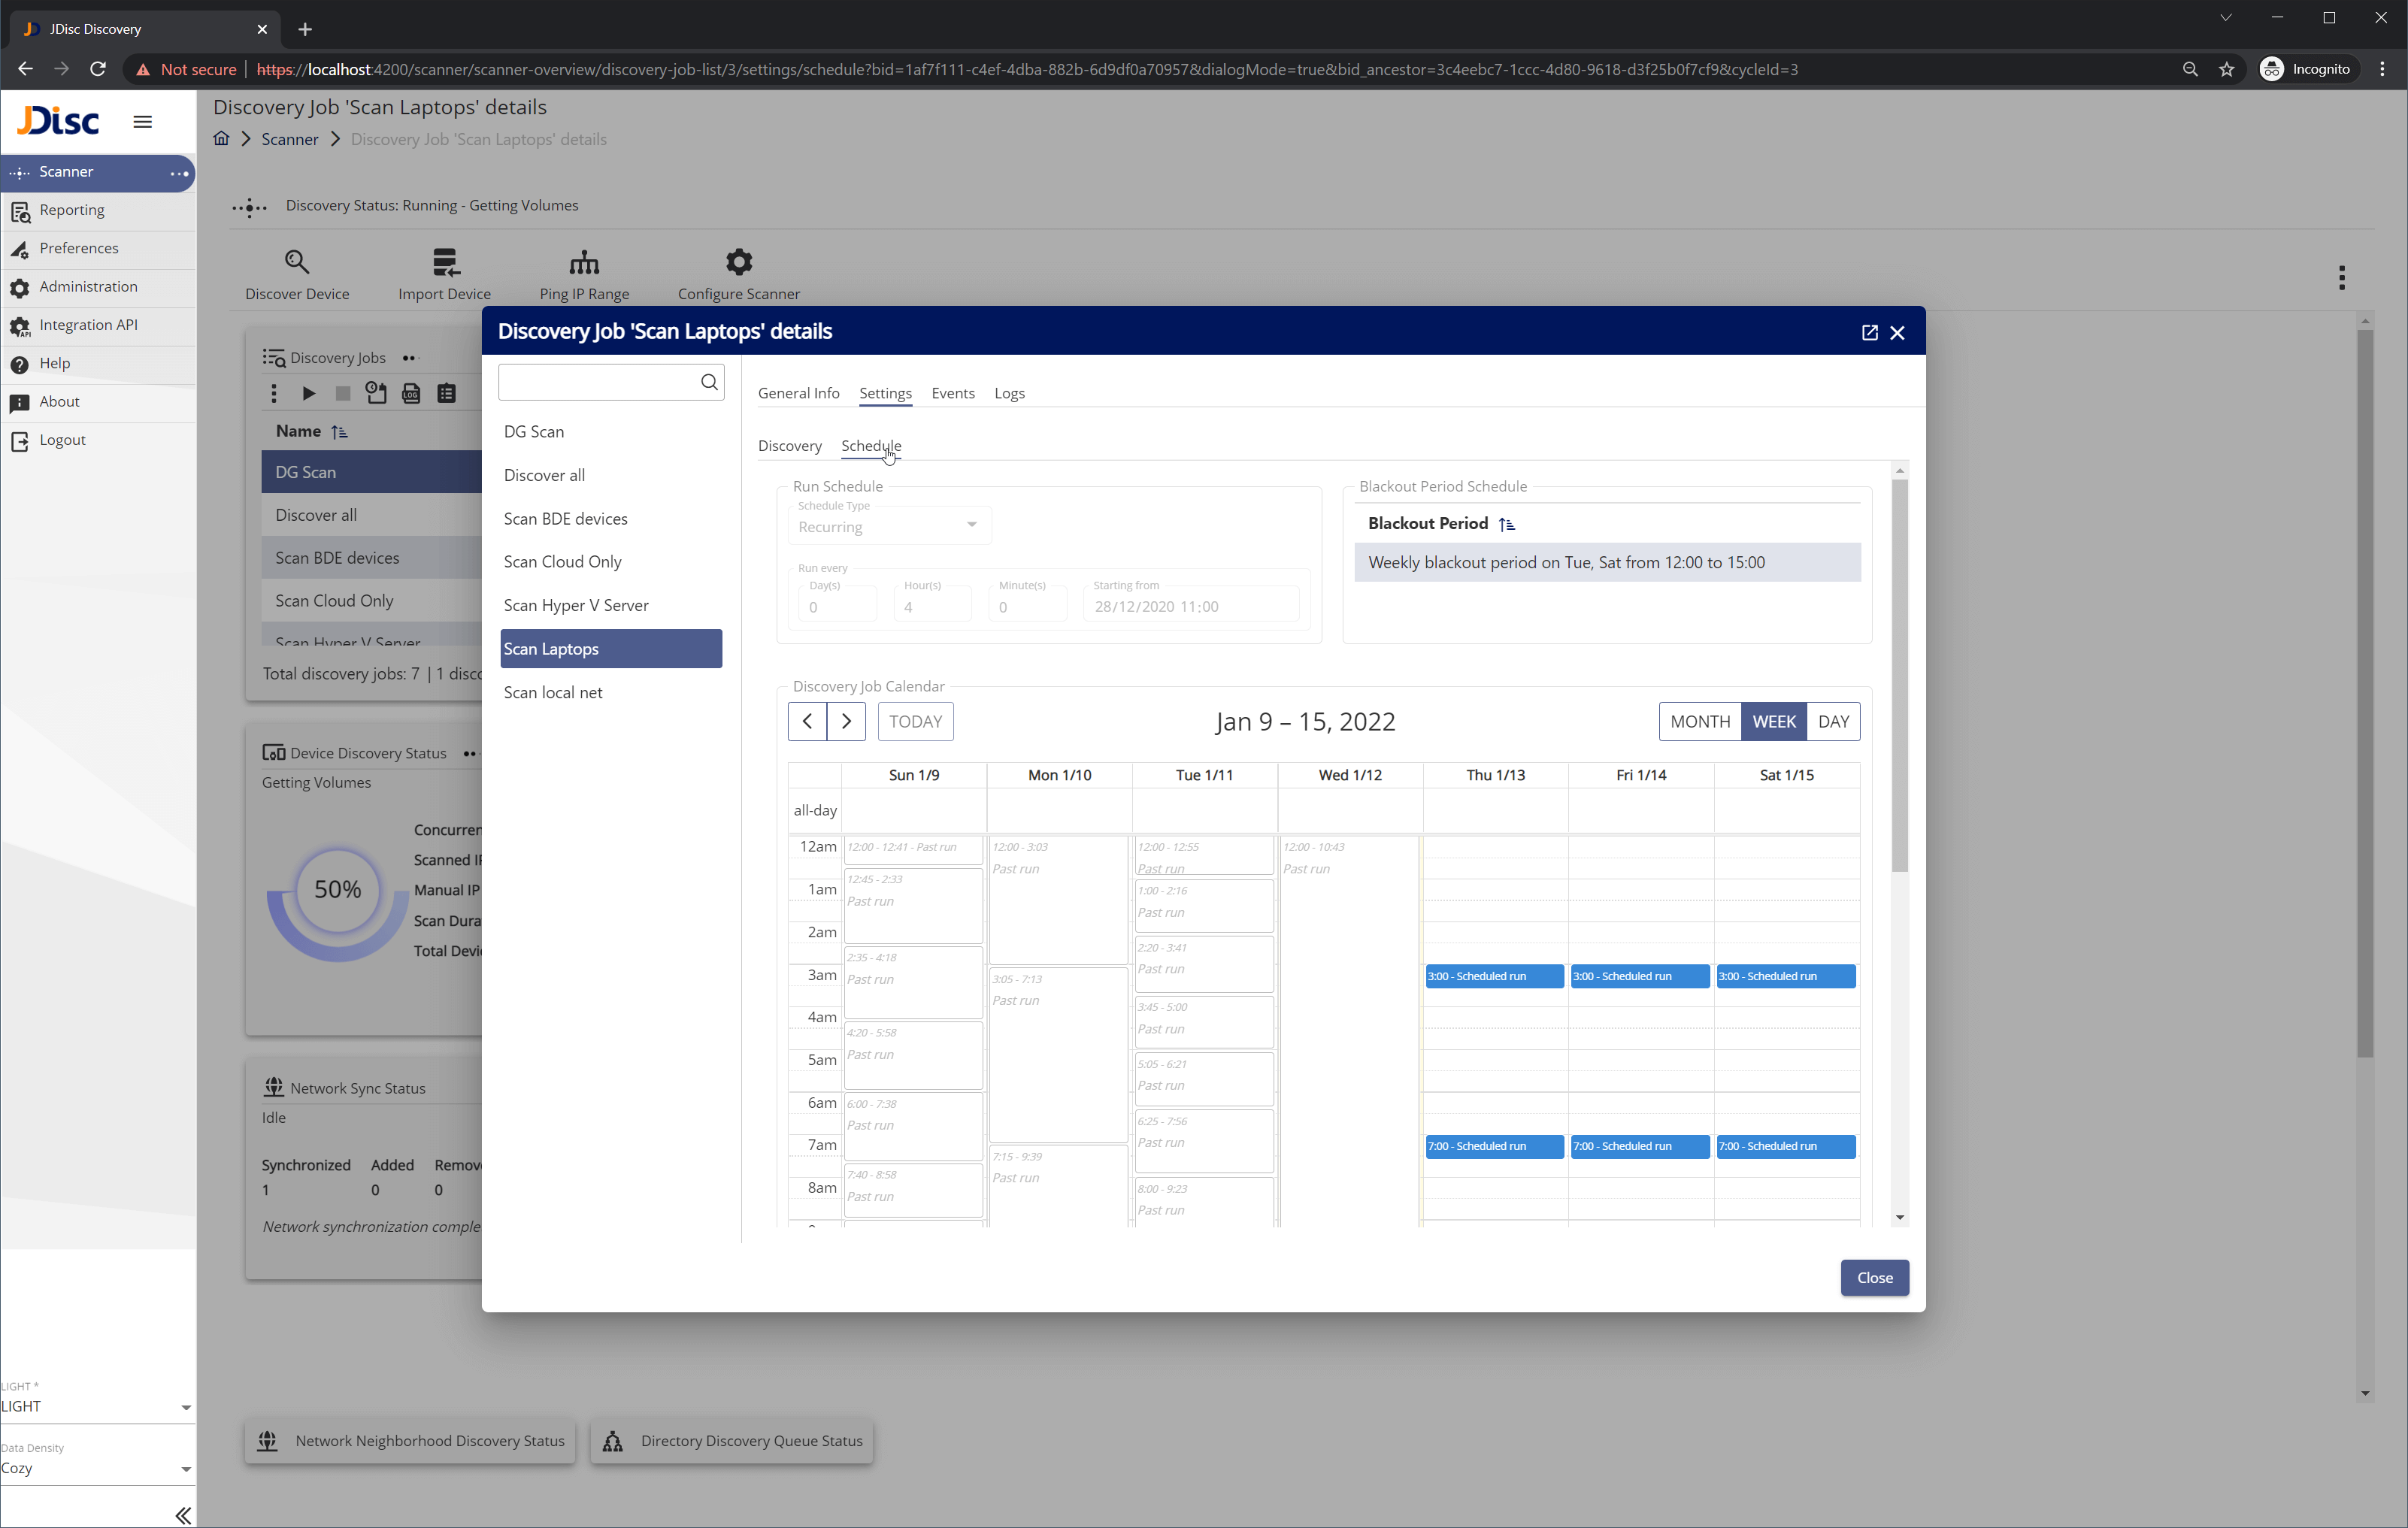
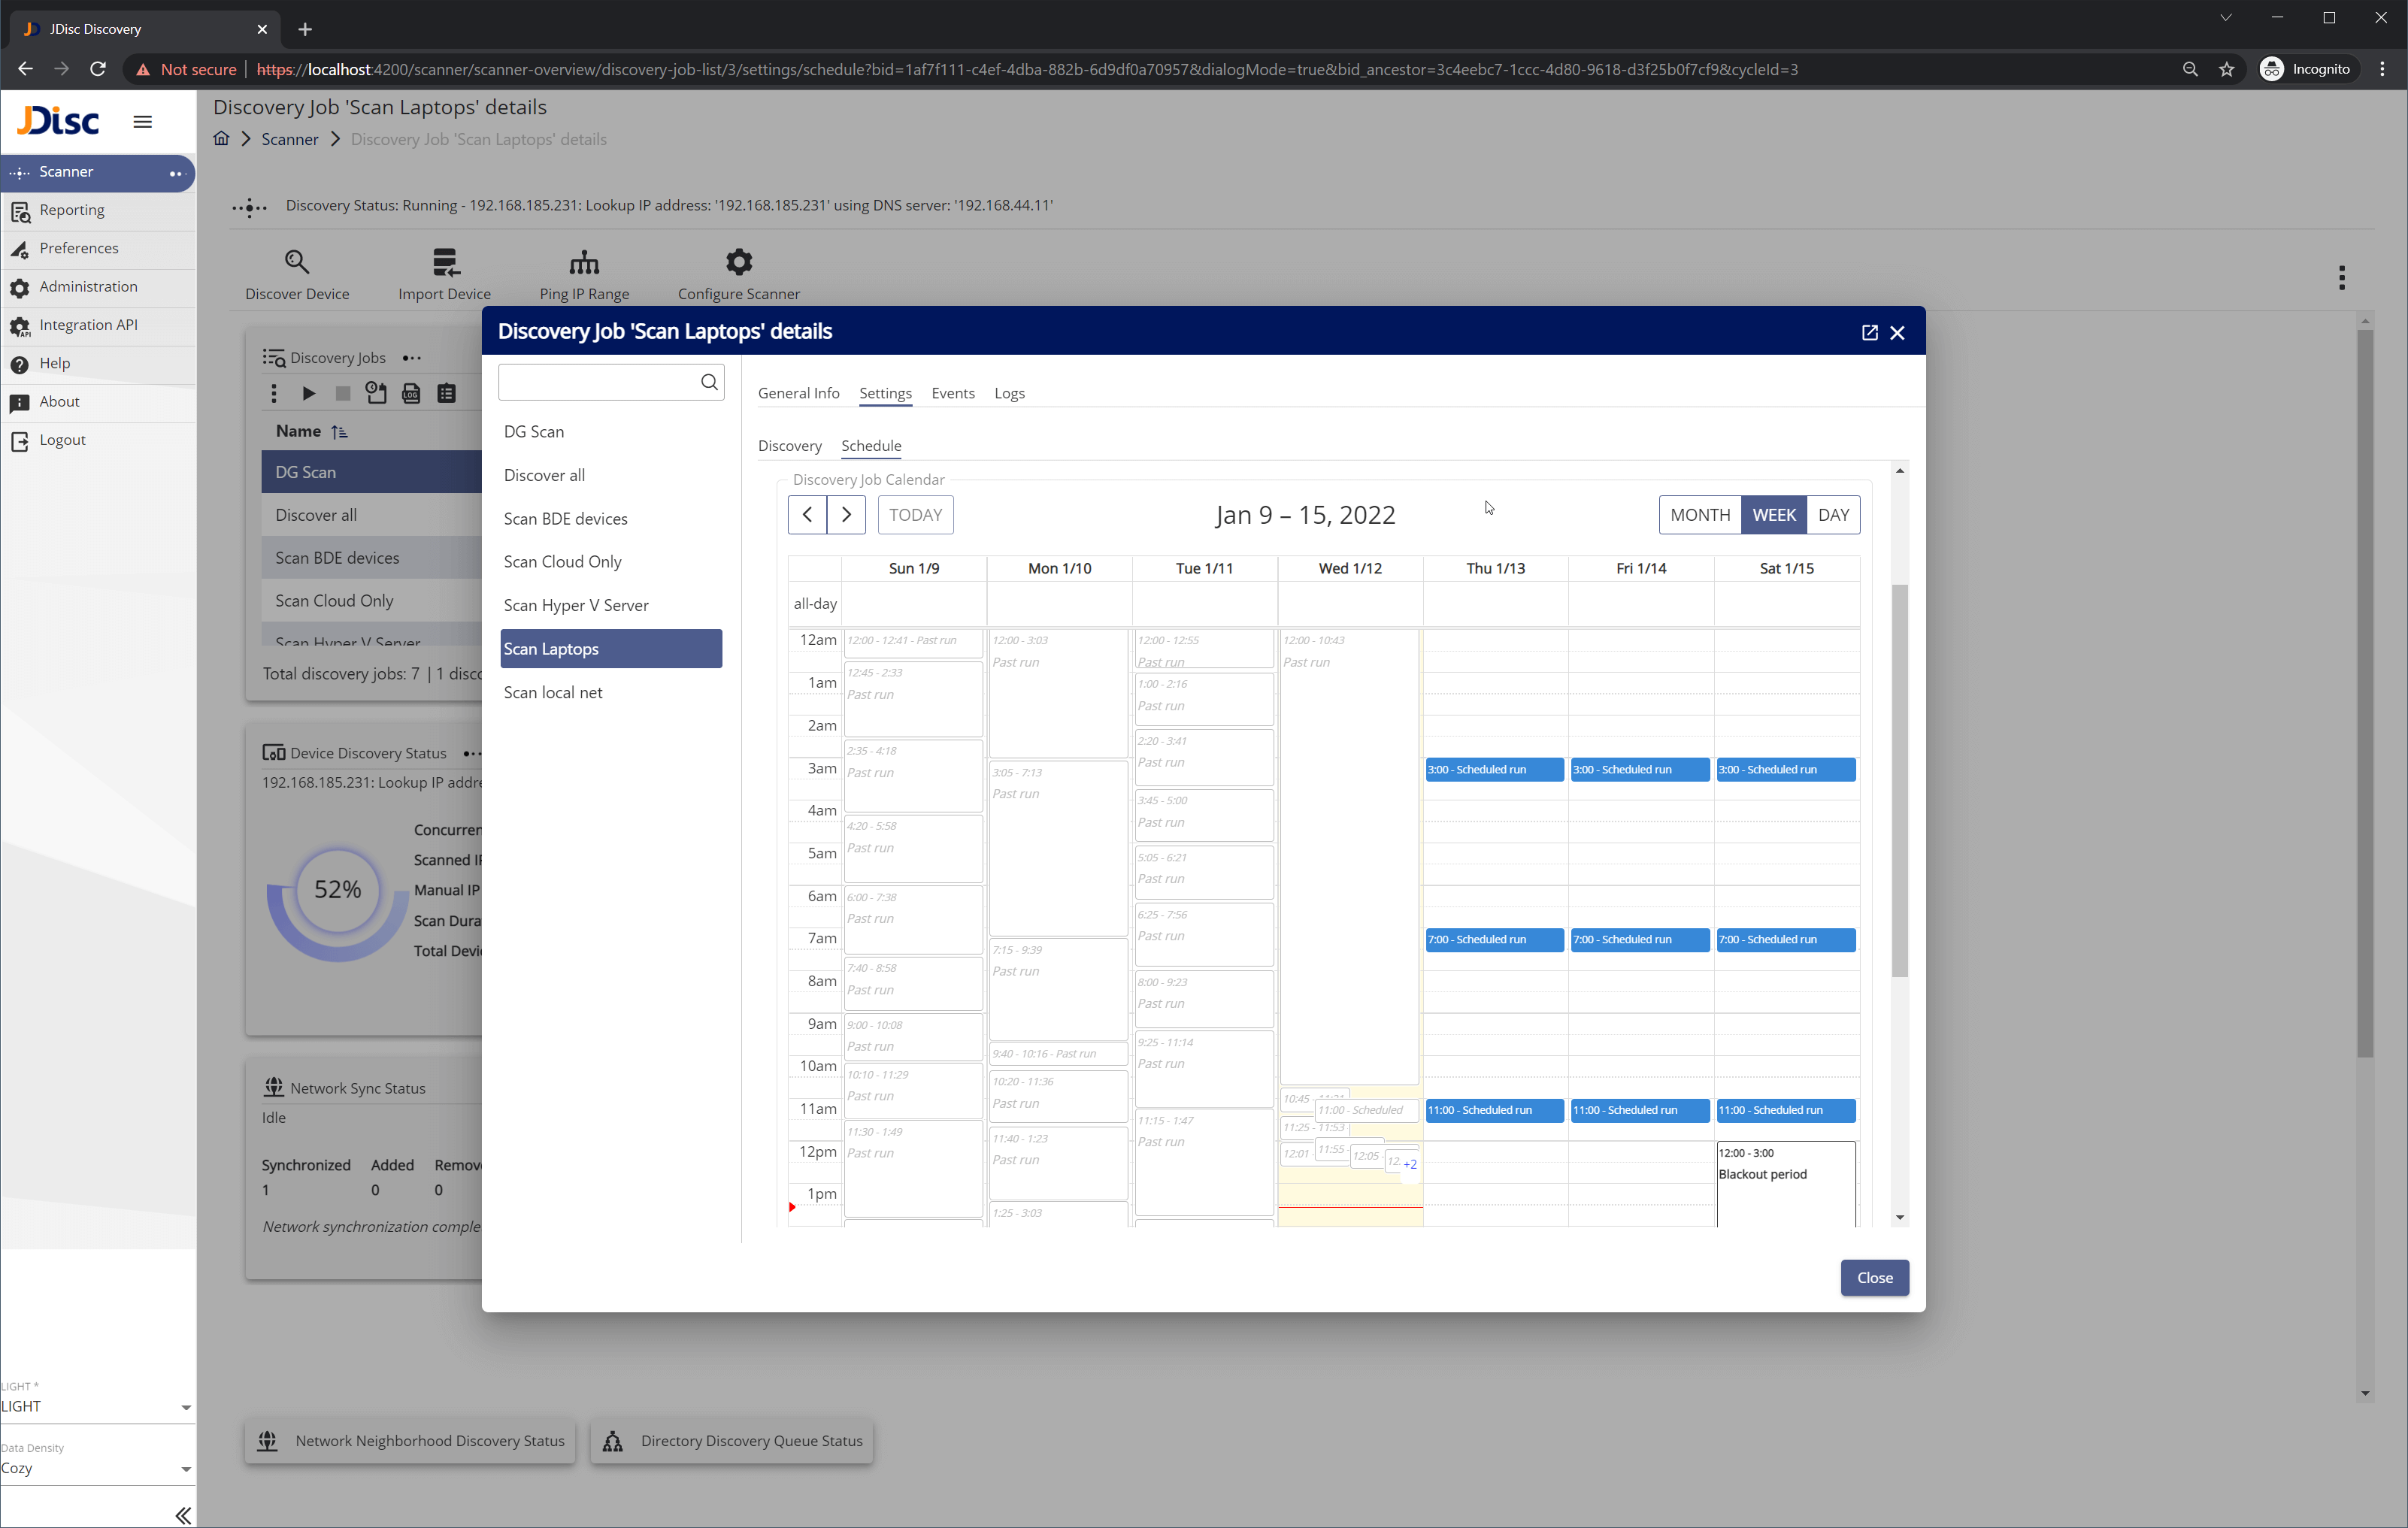
From the discovery job details dialog, you can navigate to the discovery settings tab (Figure 3.2.1) or to the discovery schedule tab (Figure 3.2.2). The schedule tab includes a calendar view (Figure 3.2.3), where the discovery job past runs (light grey), schedules runs (blue) and blackout periods (black) are visualized.

For the moment, all information is read-only.

Figure-3.2.1-1 Discovery settings
Figure 3.2.1 – Discovery settings
Figure-3.2.2-1 Schedule settings
Figure 3.2.2 – Schedule settings
Figure-3.2.3-1 Schedule calendar view
Figure 3.2.3 – Schedule calendar view

3.3 Discovery Job events

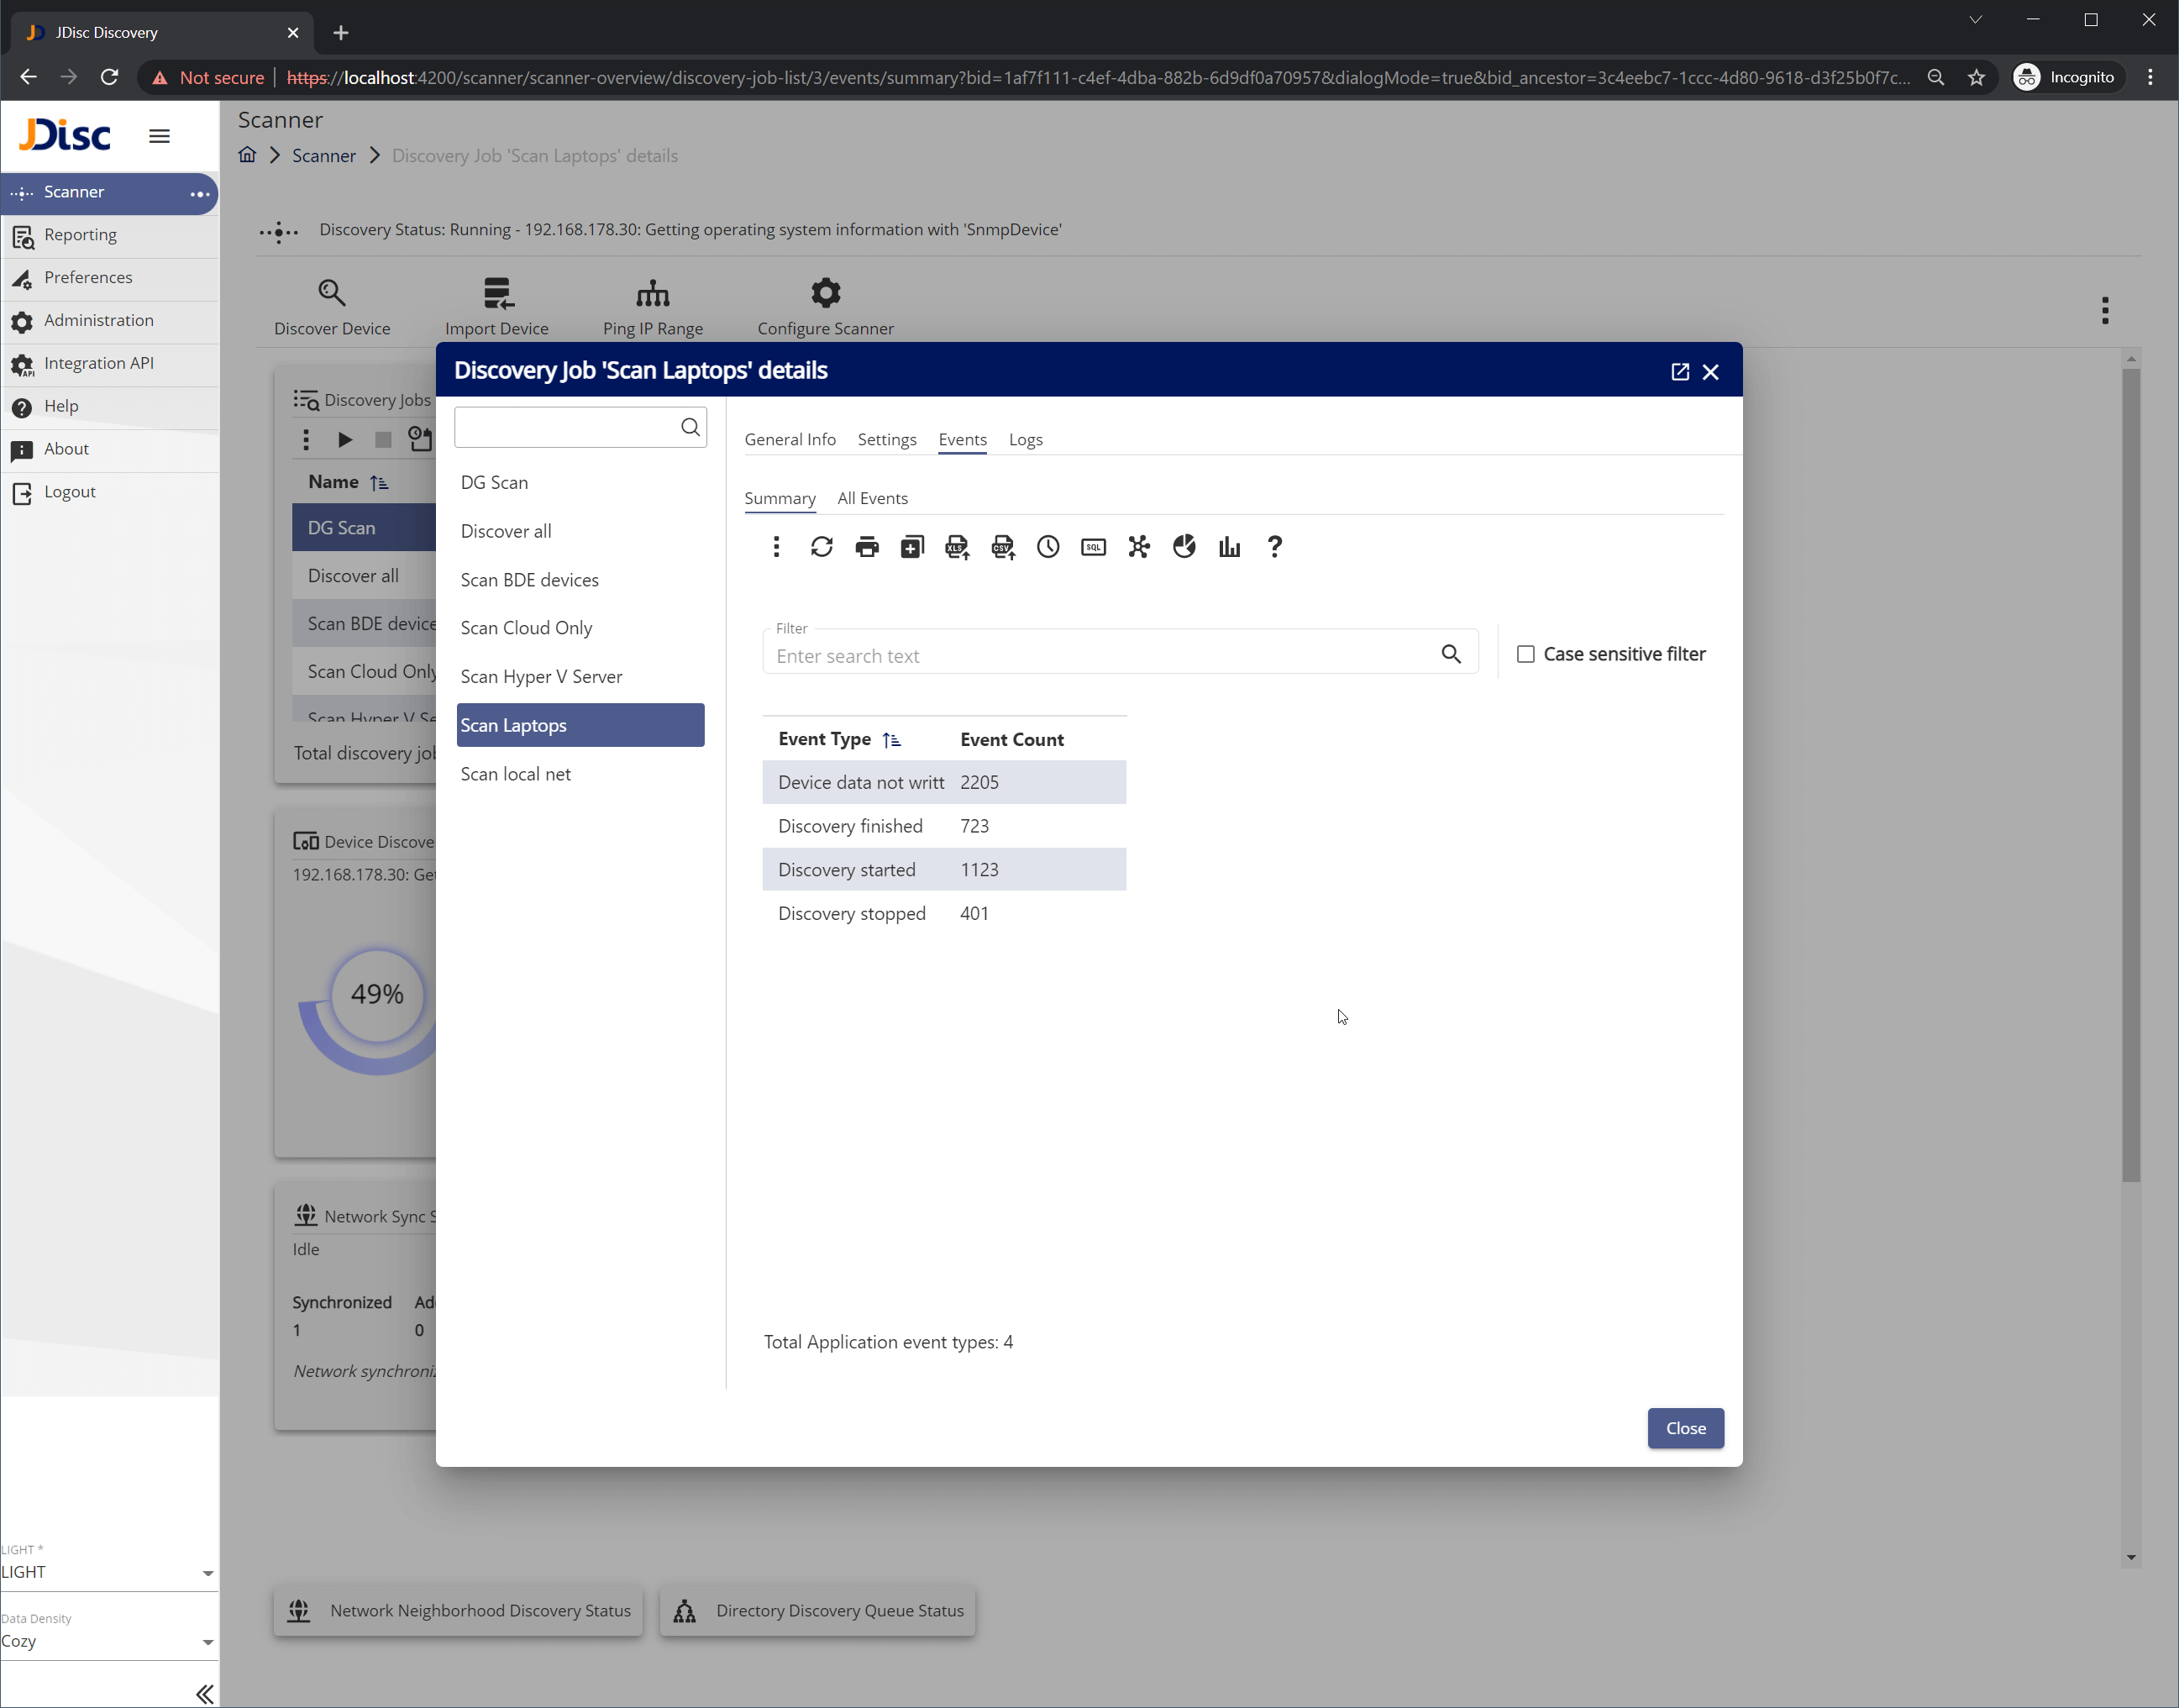
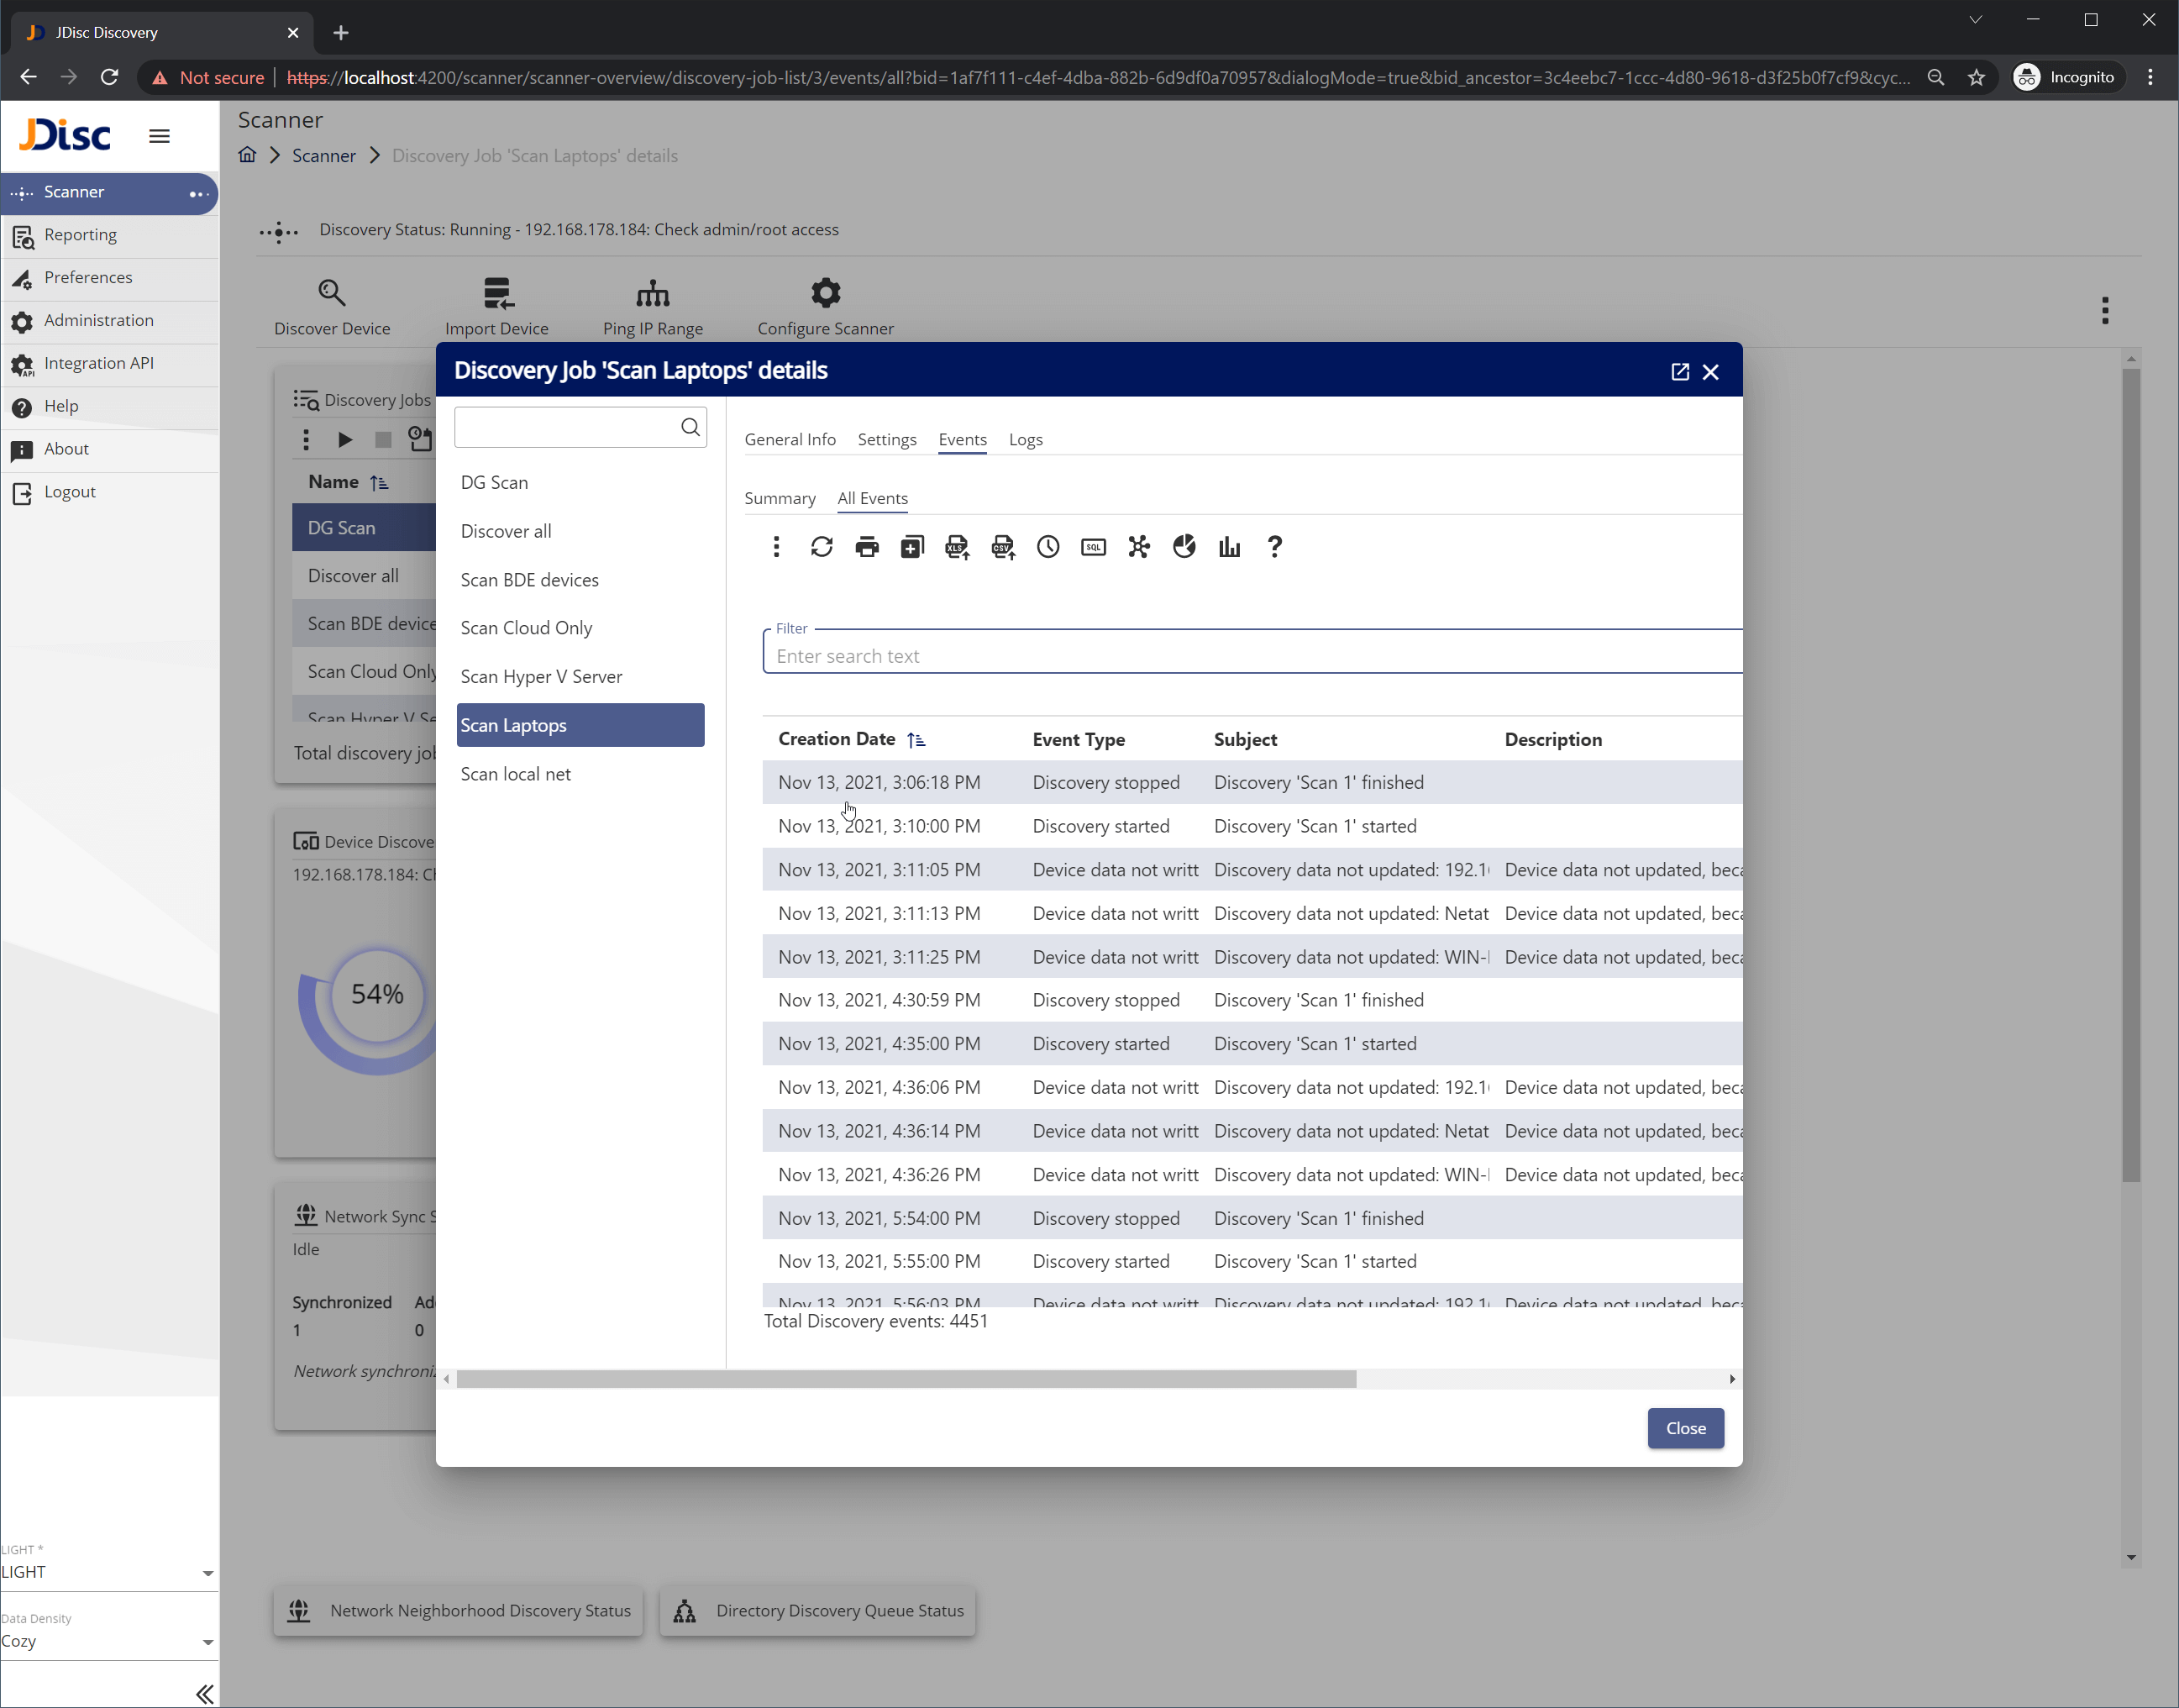
From the discovery job details dialog, you can navigate to the discovery events summary tab (Figure 3.3.1) or to the discovery all events tab (Figure 3.3.2), in order to get an overview of what type of events the discovery job generates, and – if necessary – list all of them. This view is used frequently during troubleshooting.

Figure-3.3.1-1 Events summary
Figure 3.3.1 – Events summary
Figure-3.3.2-1 All events
Figure 3.3.2 – All events

3.4 Discovery Job logs

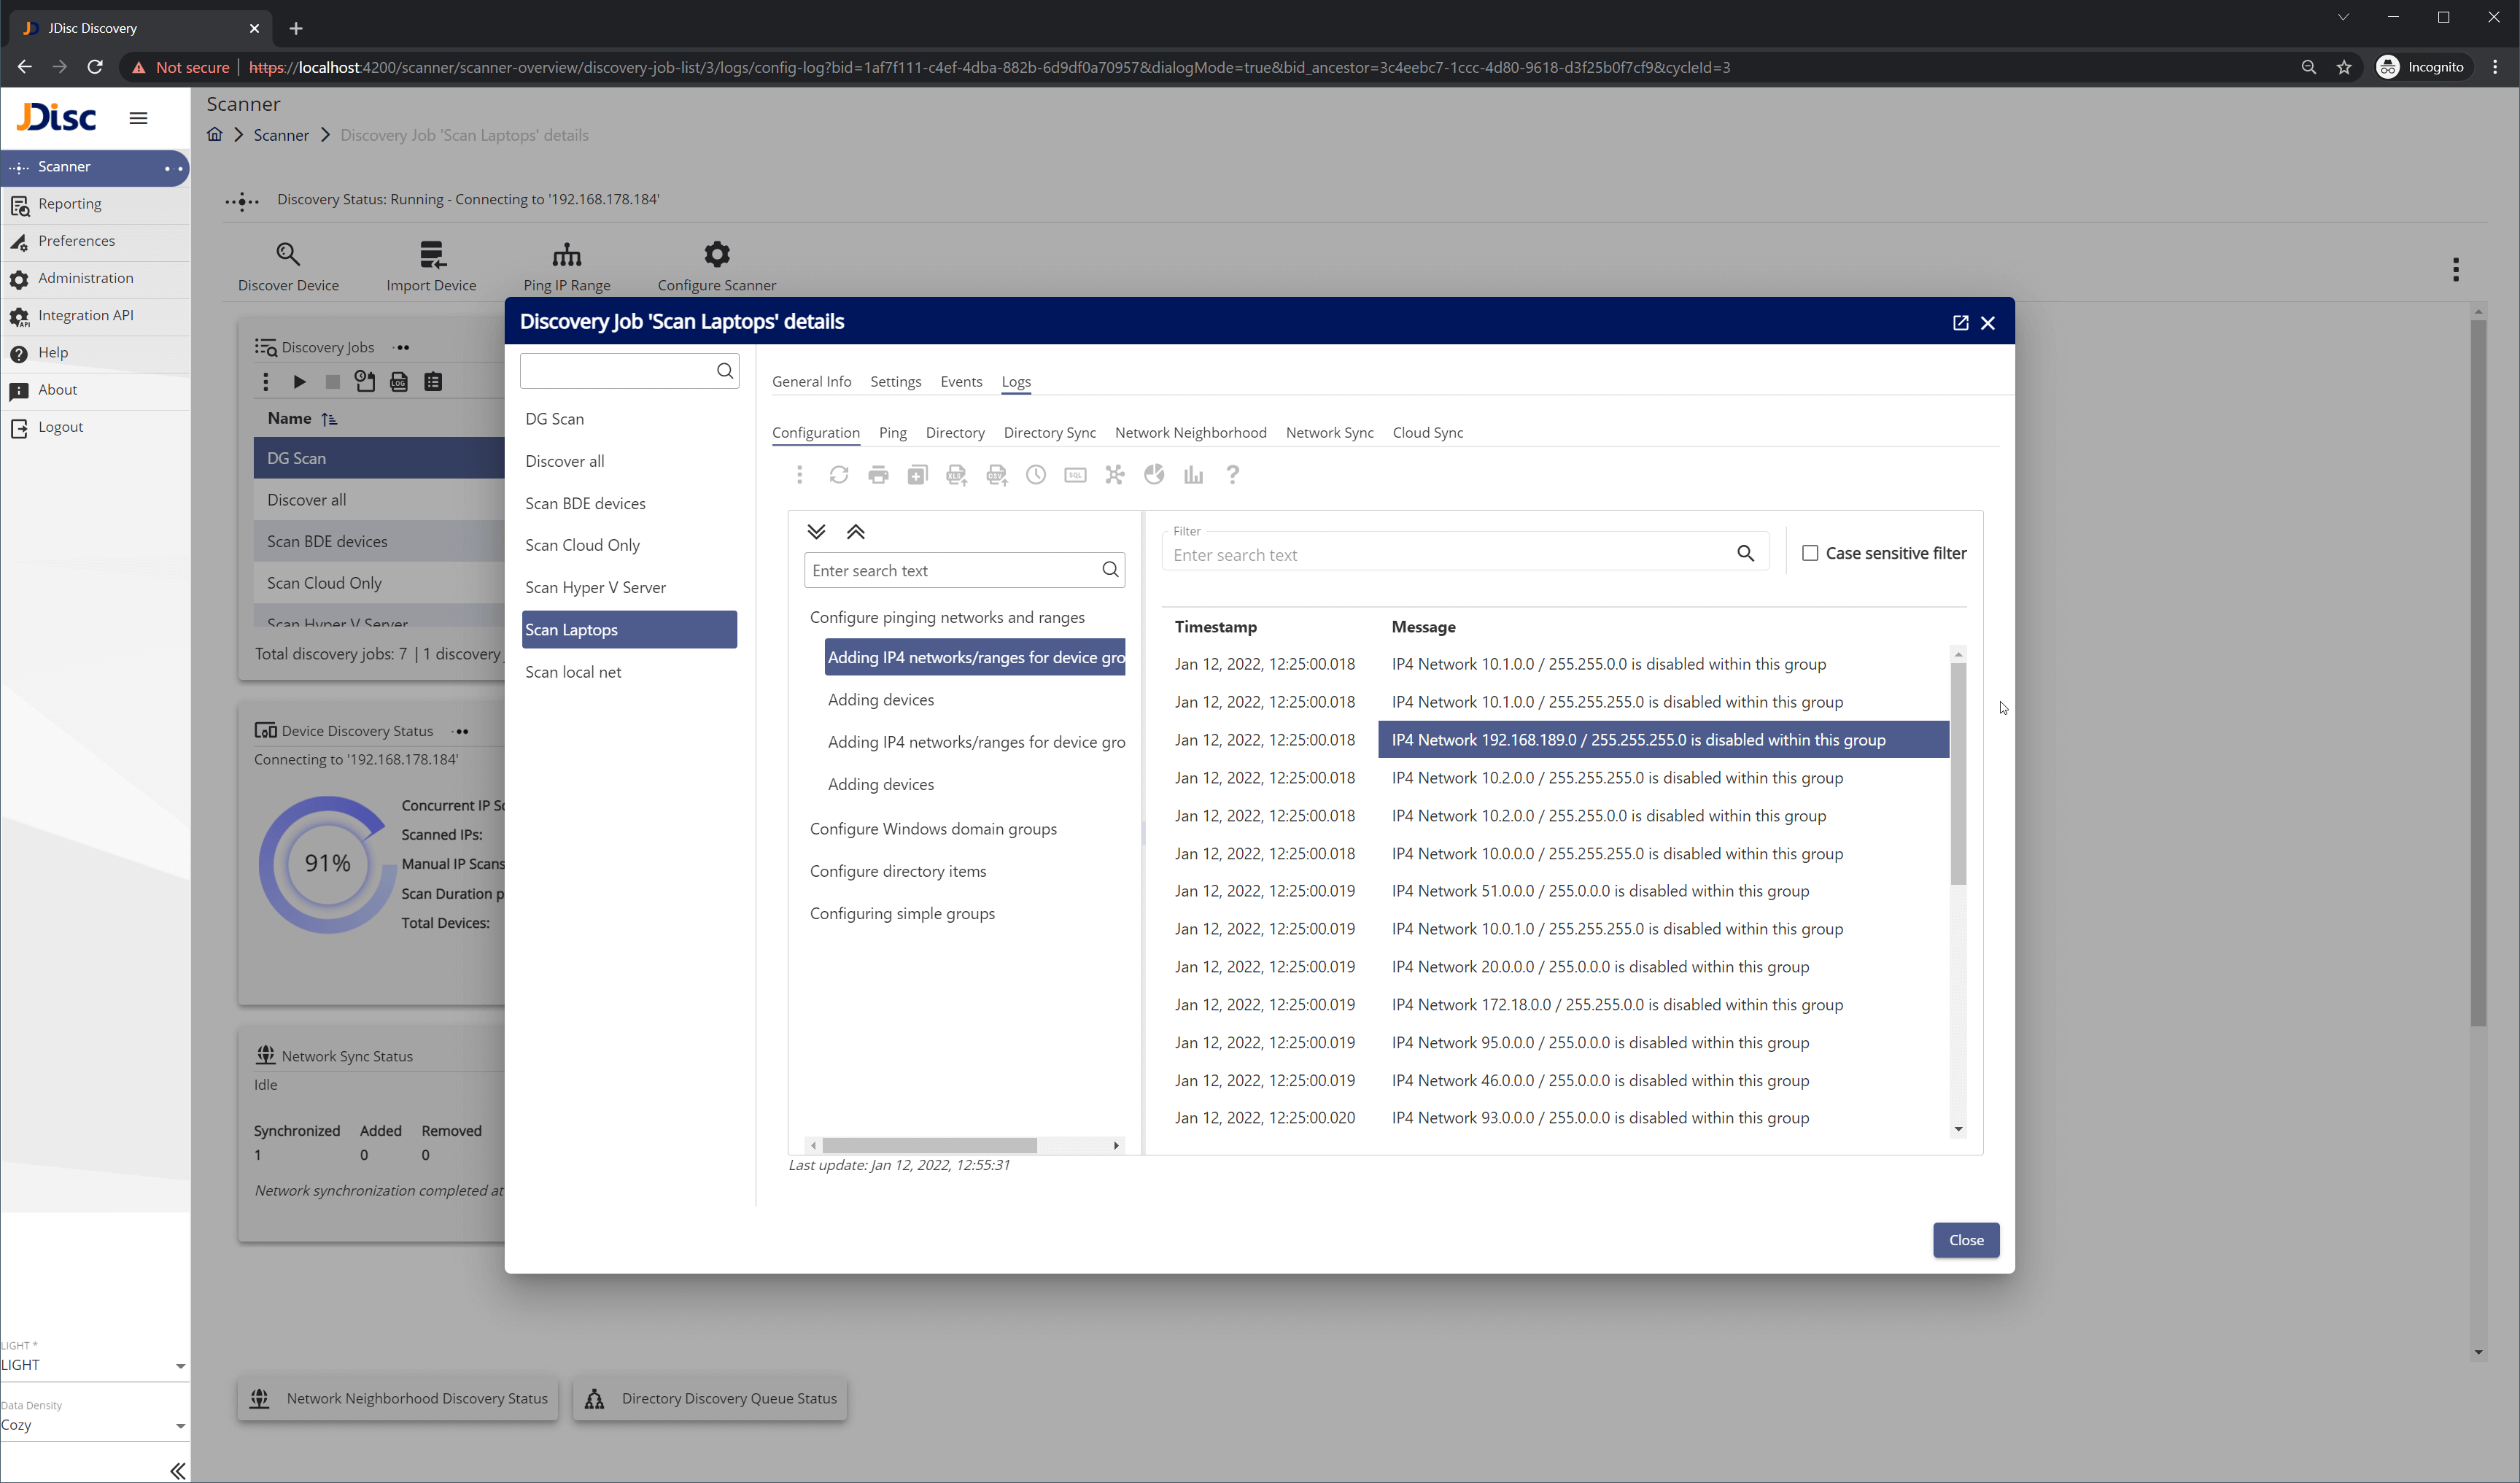
From the discovery job details dialog, you can navigate to the discovery logs tab (Figure 3.4). There are various types of logs. This view is also used frequently during troubleshooting.

Figure-3.4-1 Discovery job logs
Figure 3.4 – Discovery job logs

4. Feature Scanner dashboard items – Full screen view

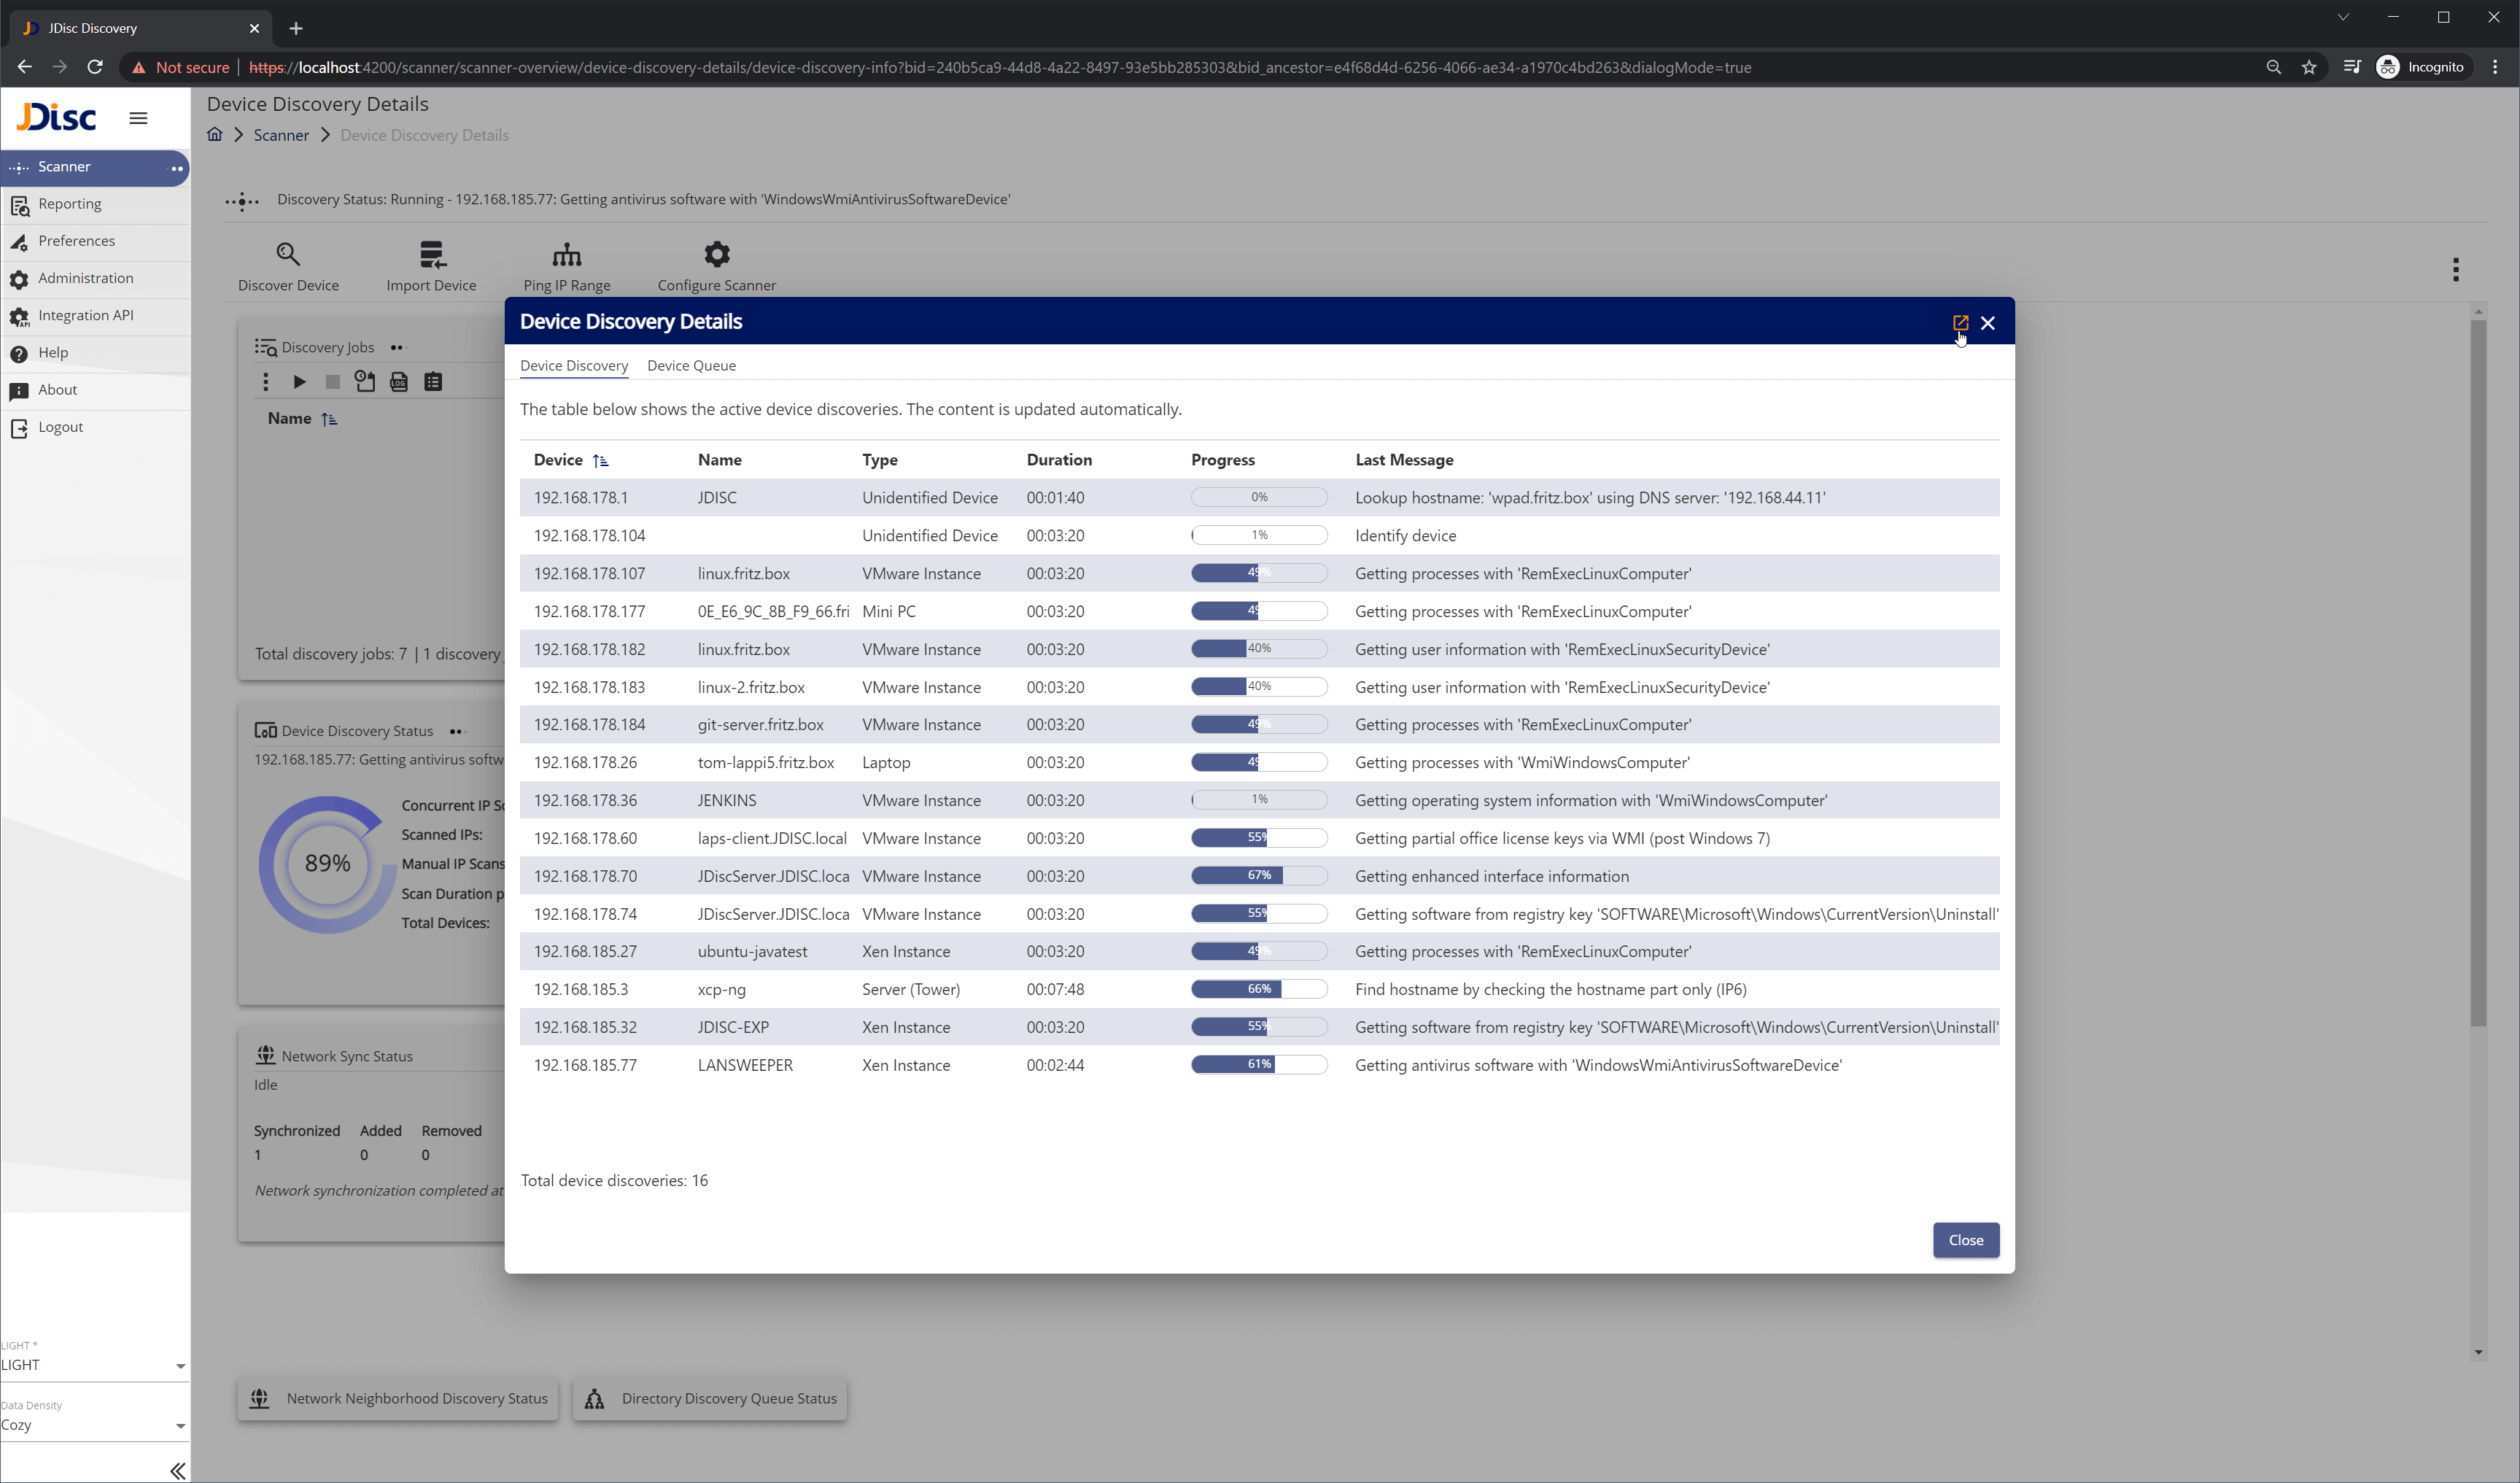
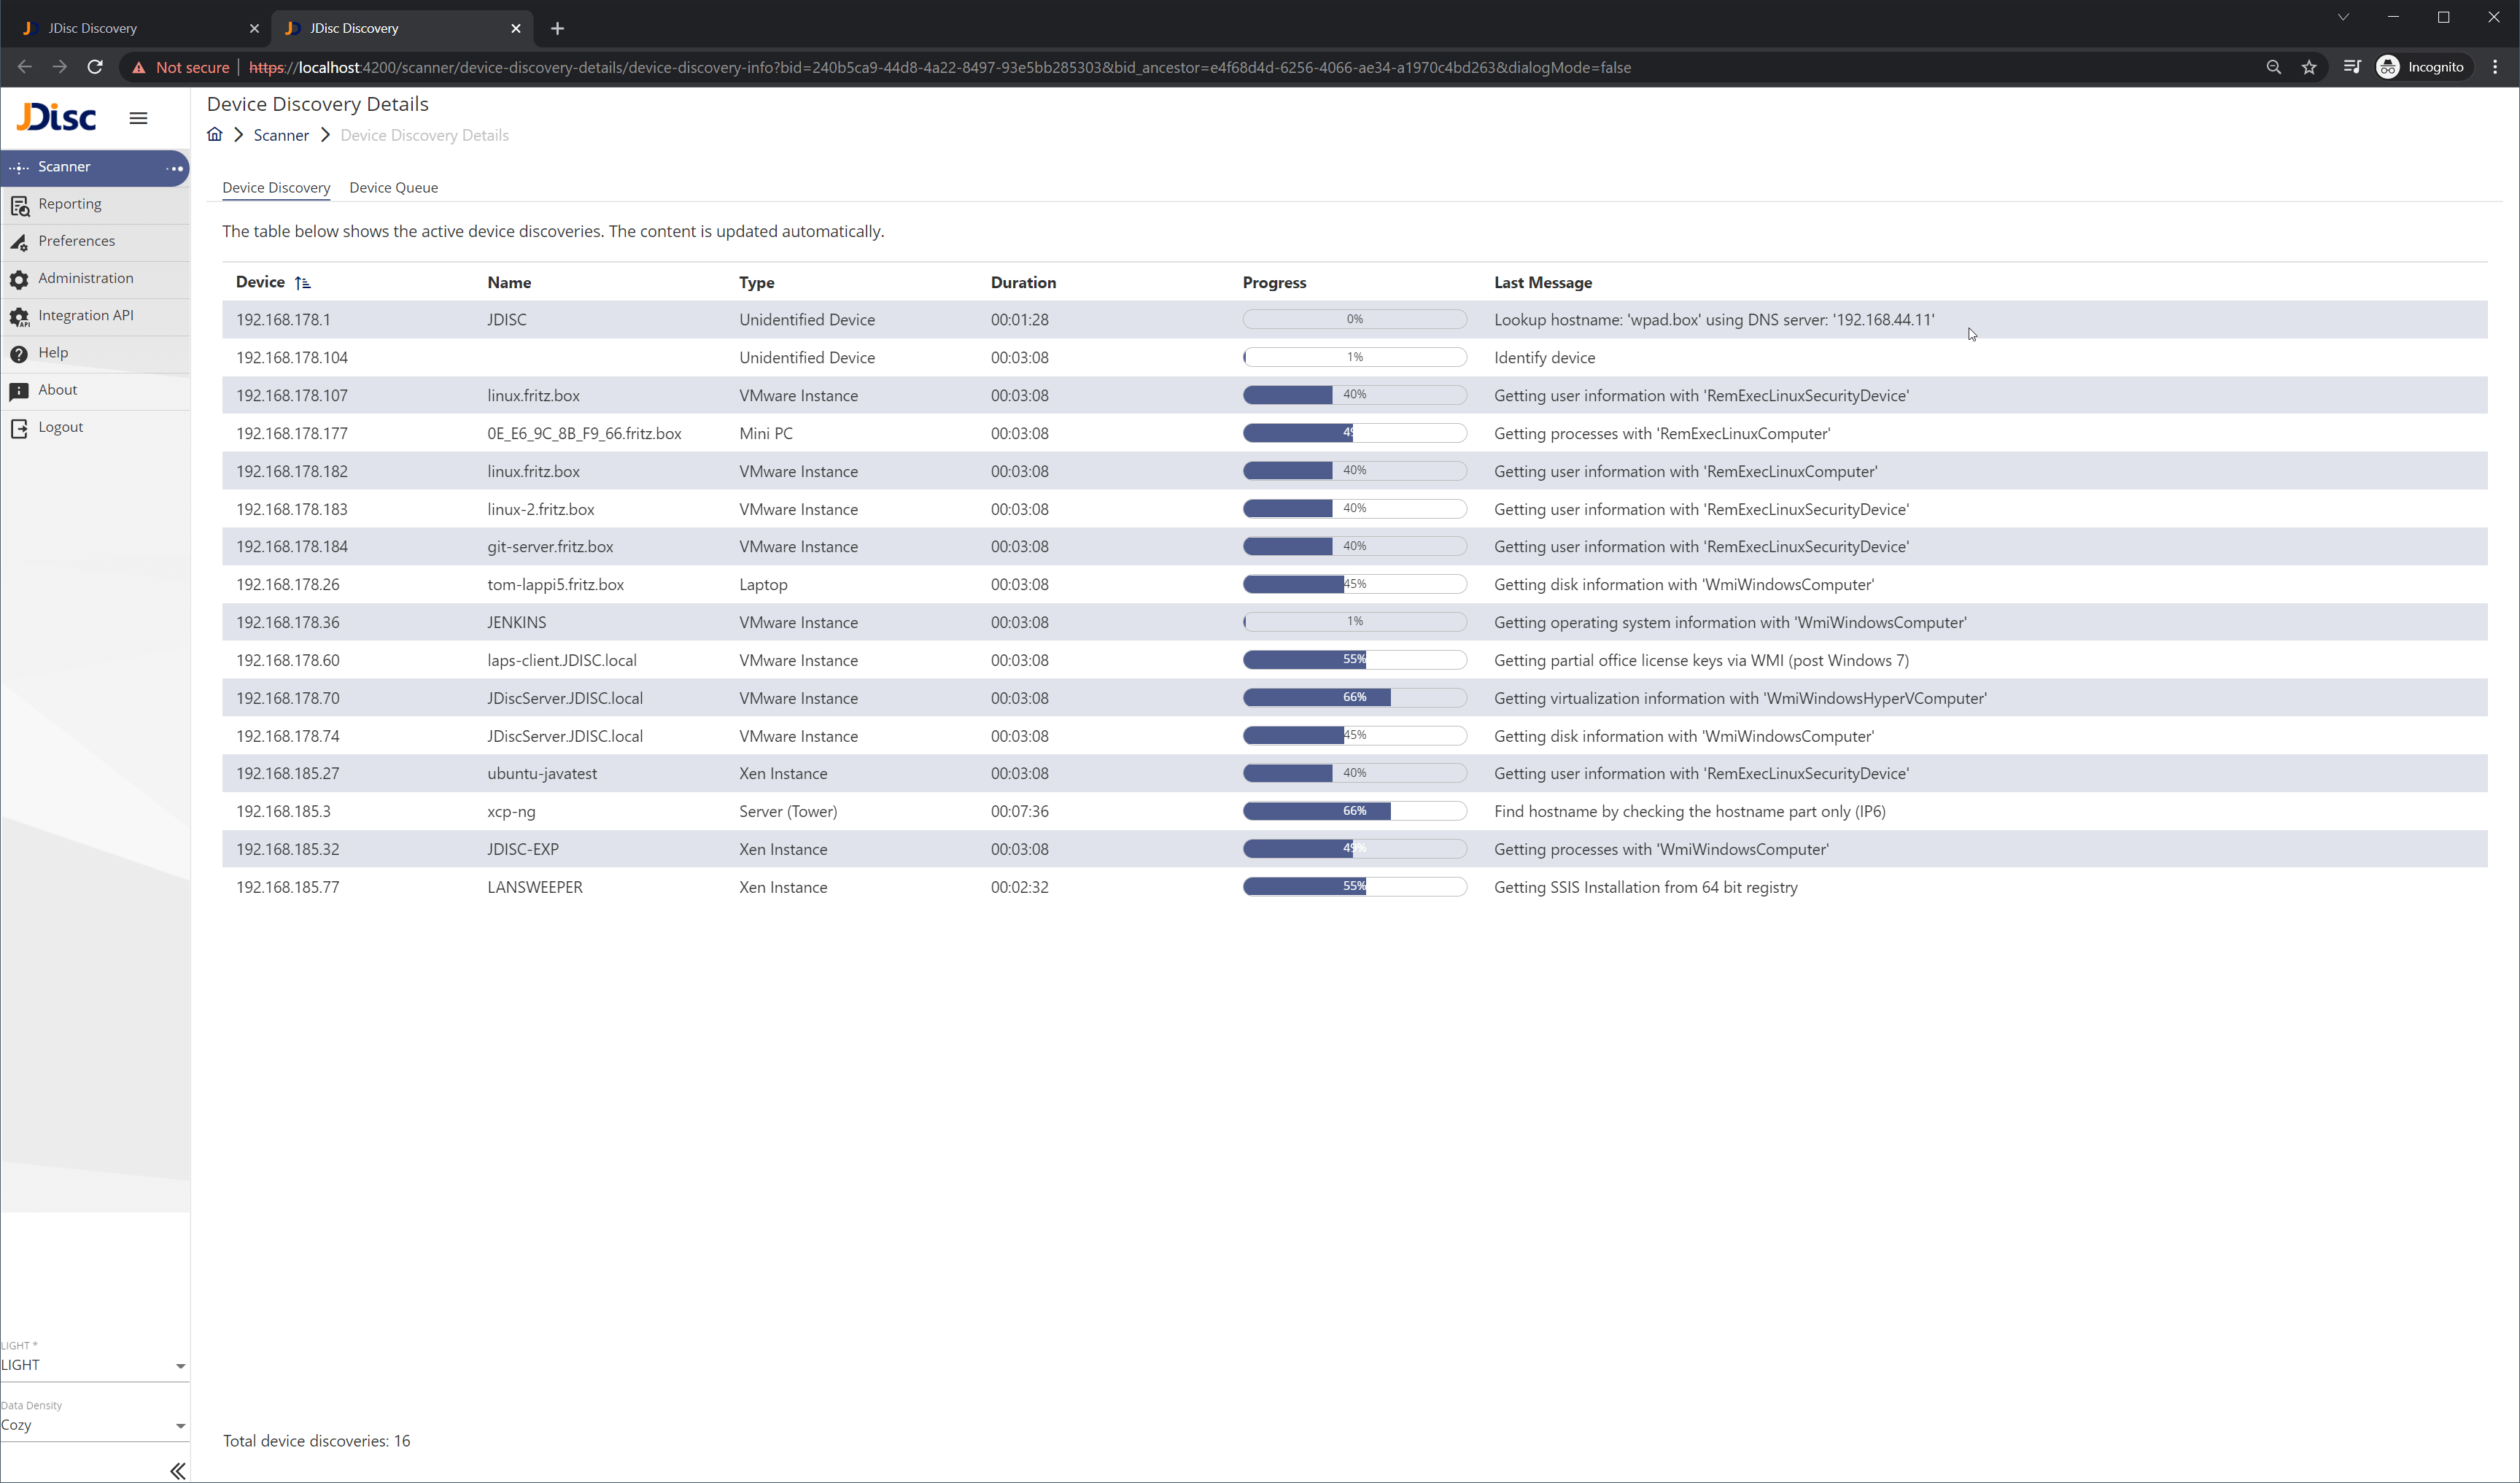
Depending on the work that you need to accomplish, you might be navigating around the various dashboard items, looking for something specific or troubleshooting. In order to make this journey convenient, we have implemented the dialog views. However, in certain cases, you might me interested in something very specific – for example the device discovery progress details (Figure 4.1). For these cases, we have implemented the full screen views. You can navigate to these views (Figure 4.2) by clicking on the expand icon on the top right corner of dialogs or dashboard items (when available).

Figure-4.1-1 Device Discovery details dialog view
Figure 4.1 – Device Discovery details dialog view
Figure-4.2-1 Device Discovery details full screen view
Figure 4.2 – Device Discovery details full screen view

5. Feature Scanner dashboard item details

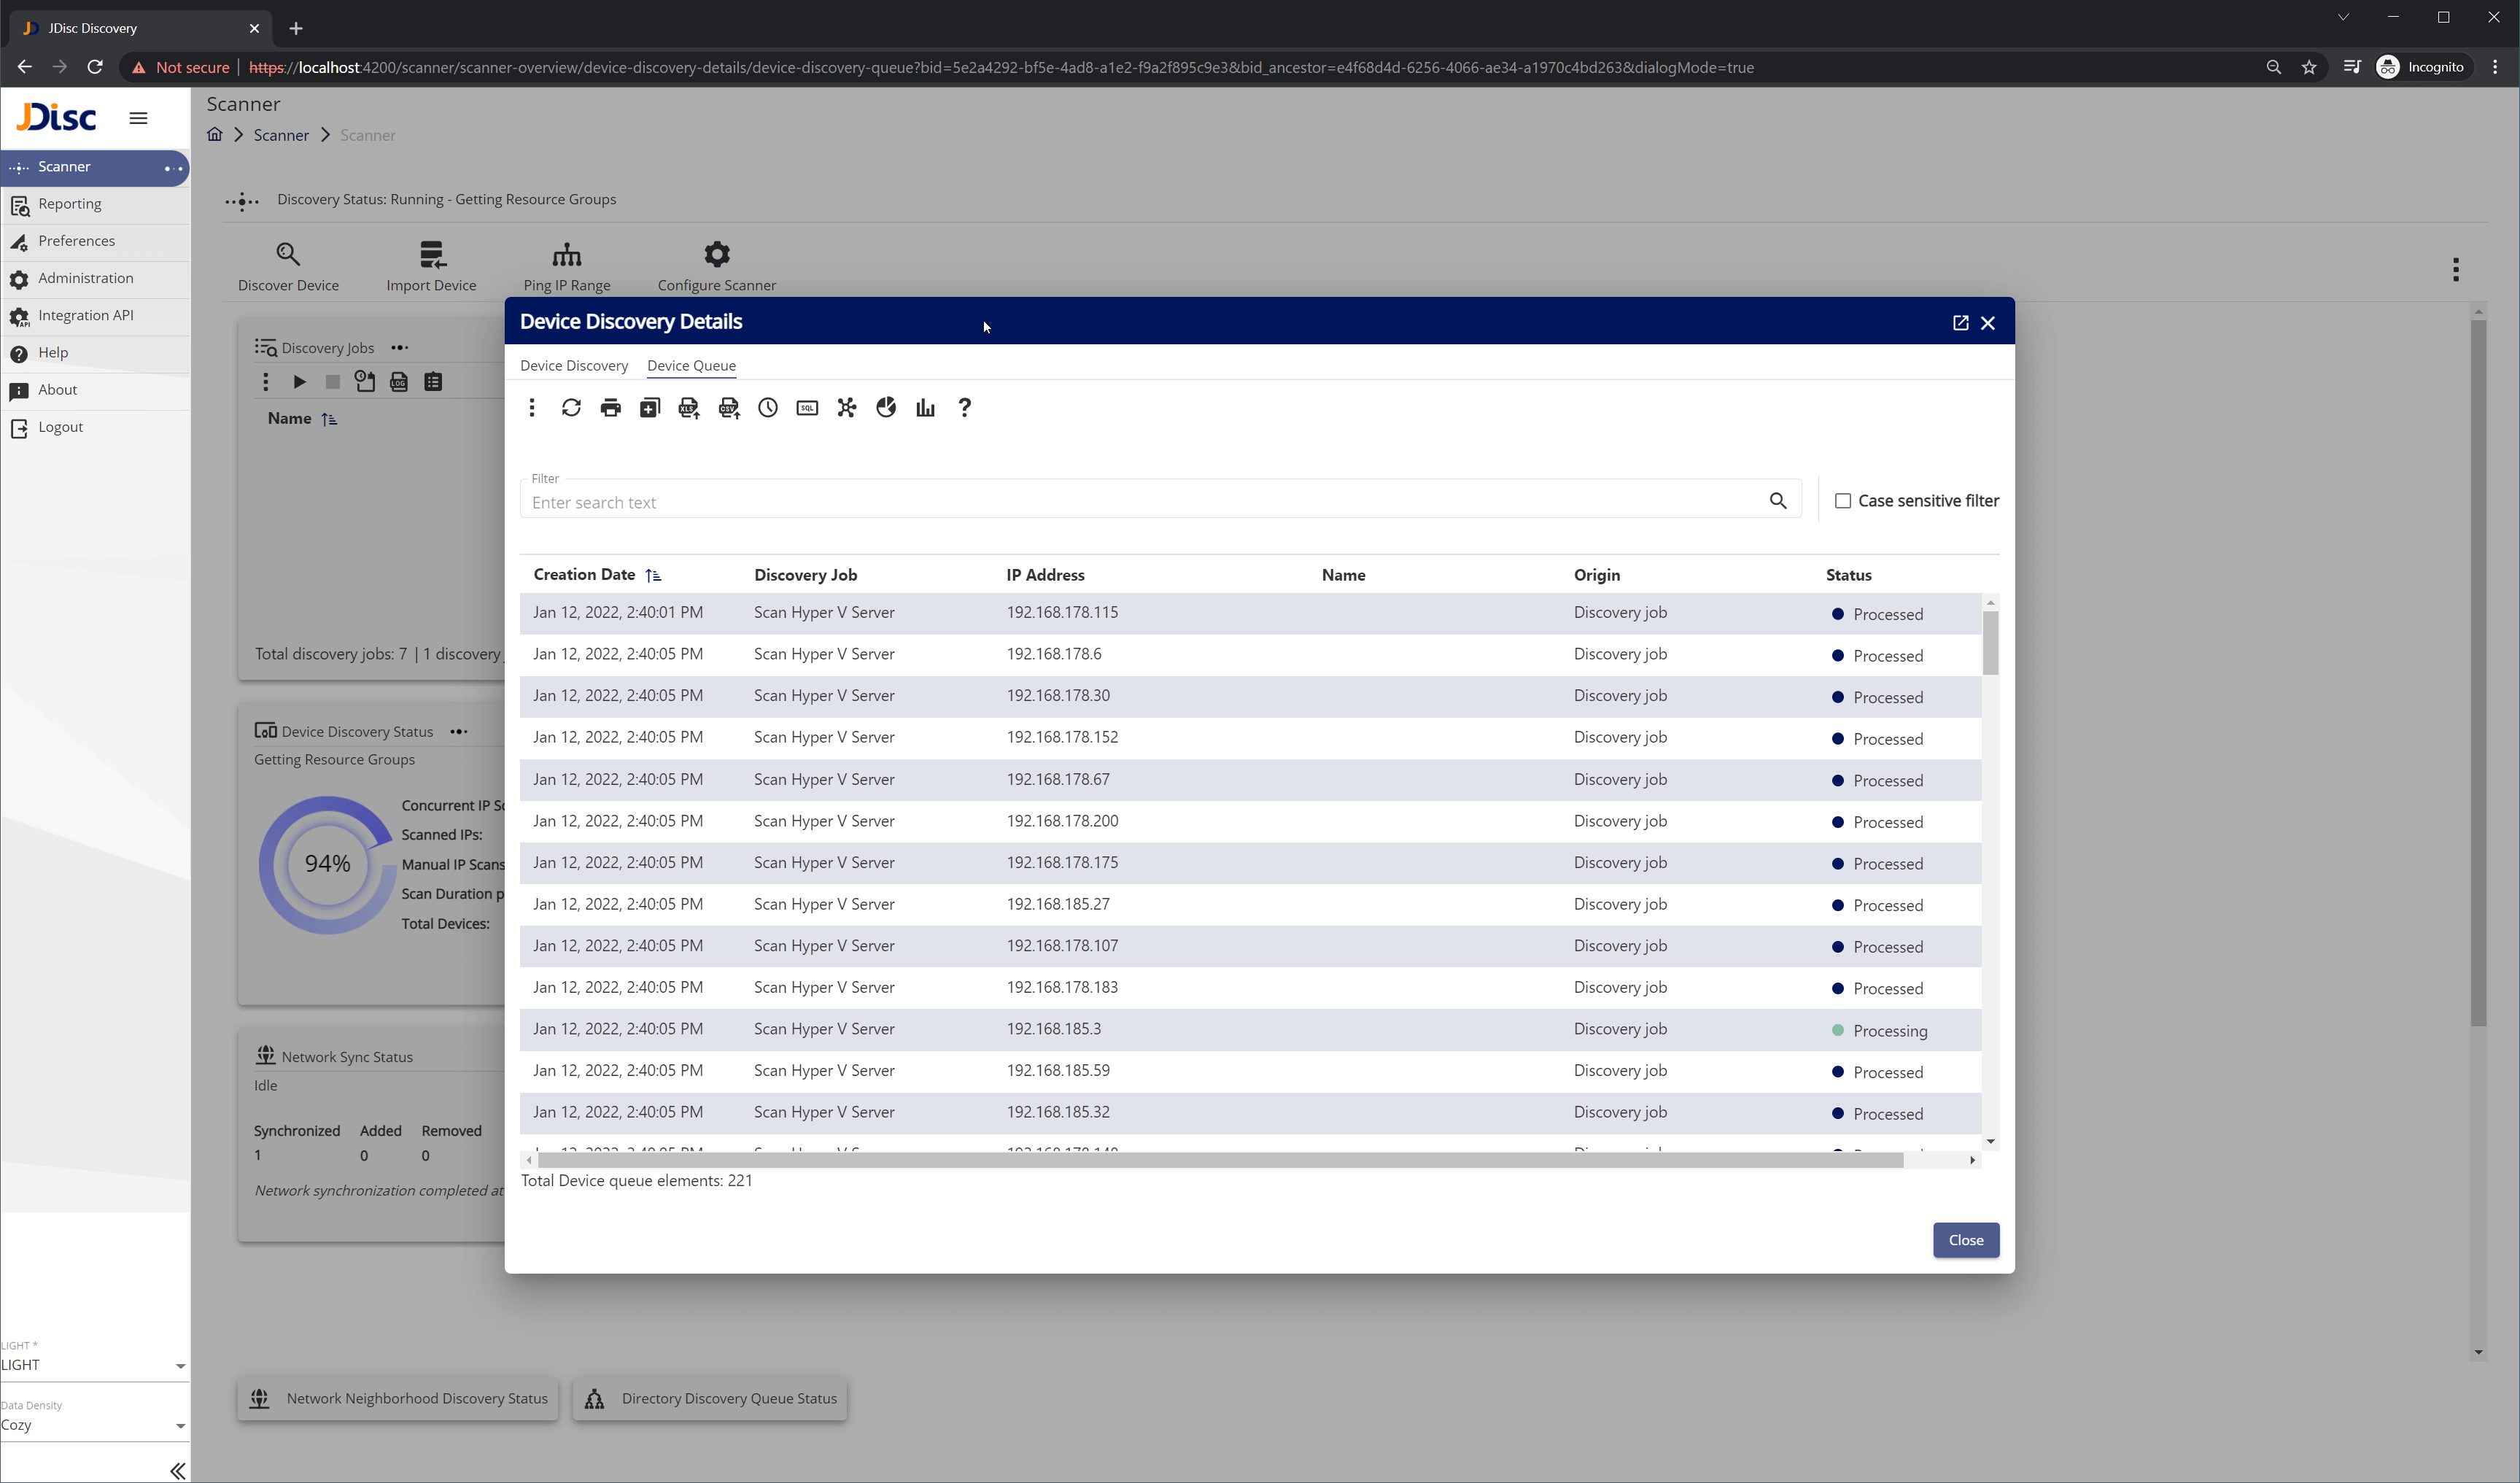
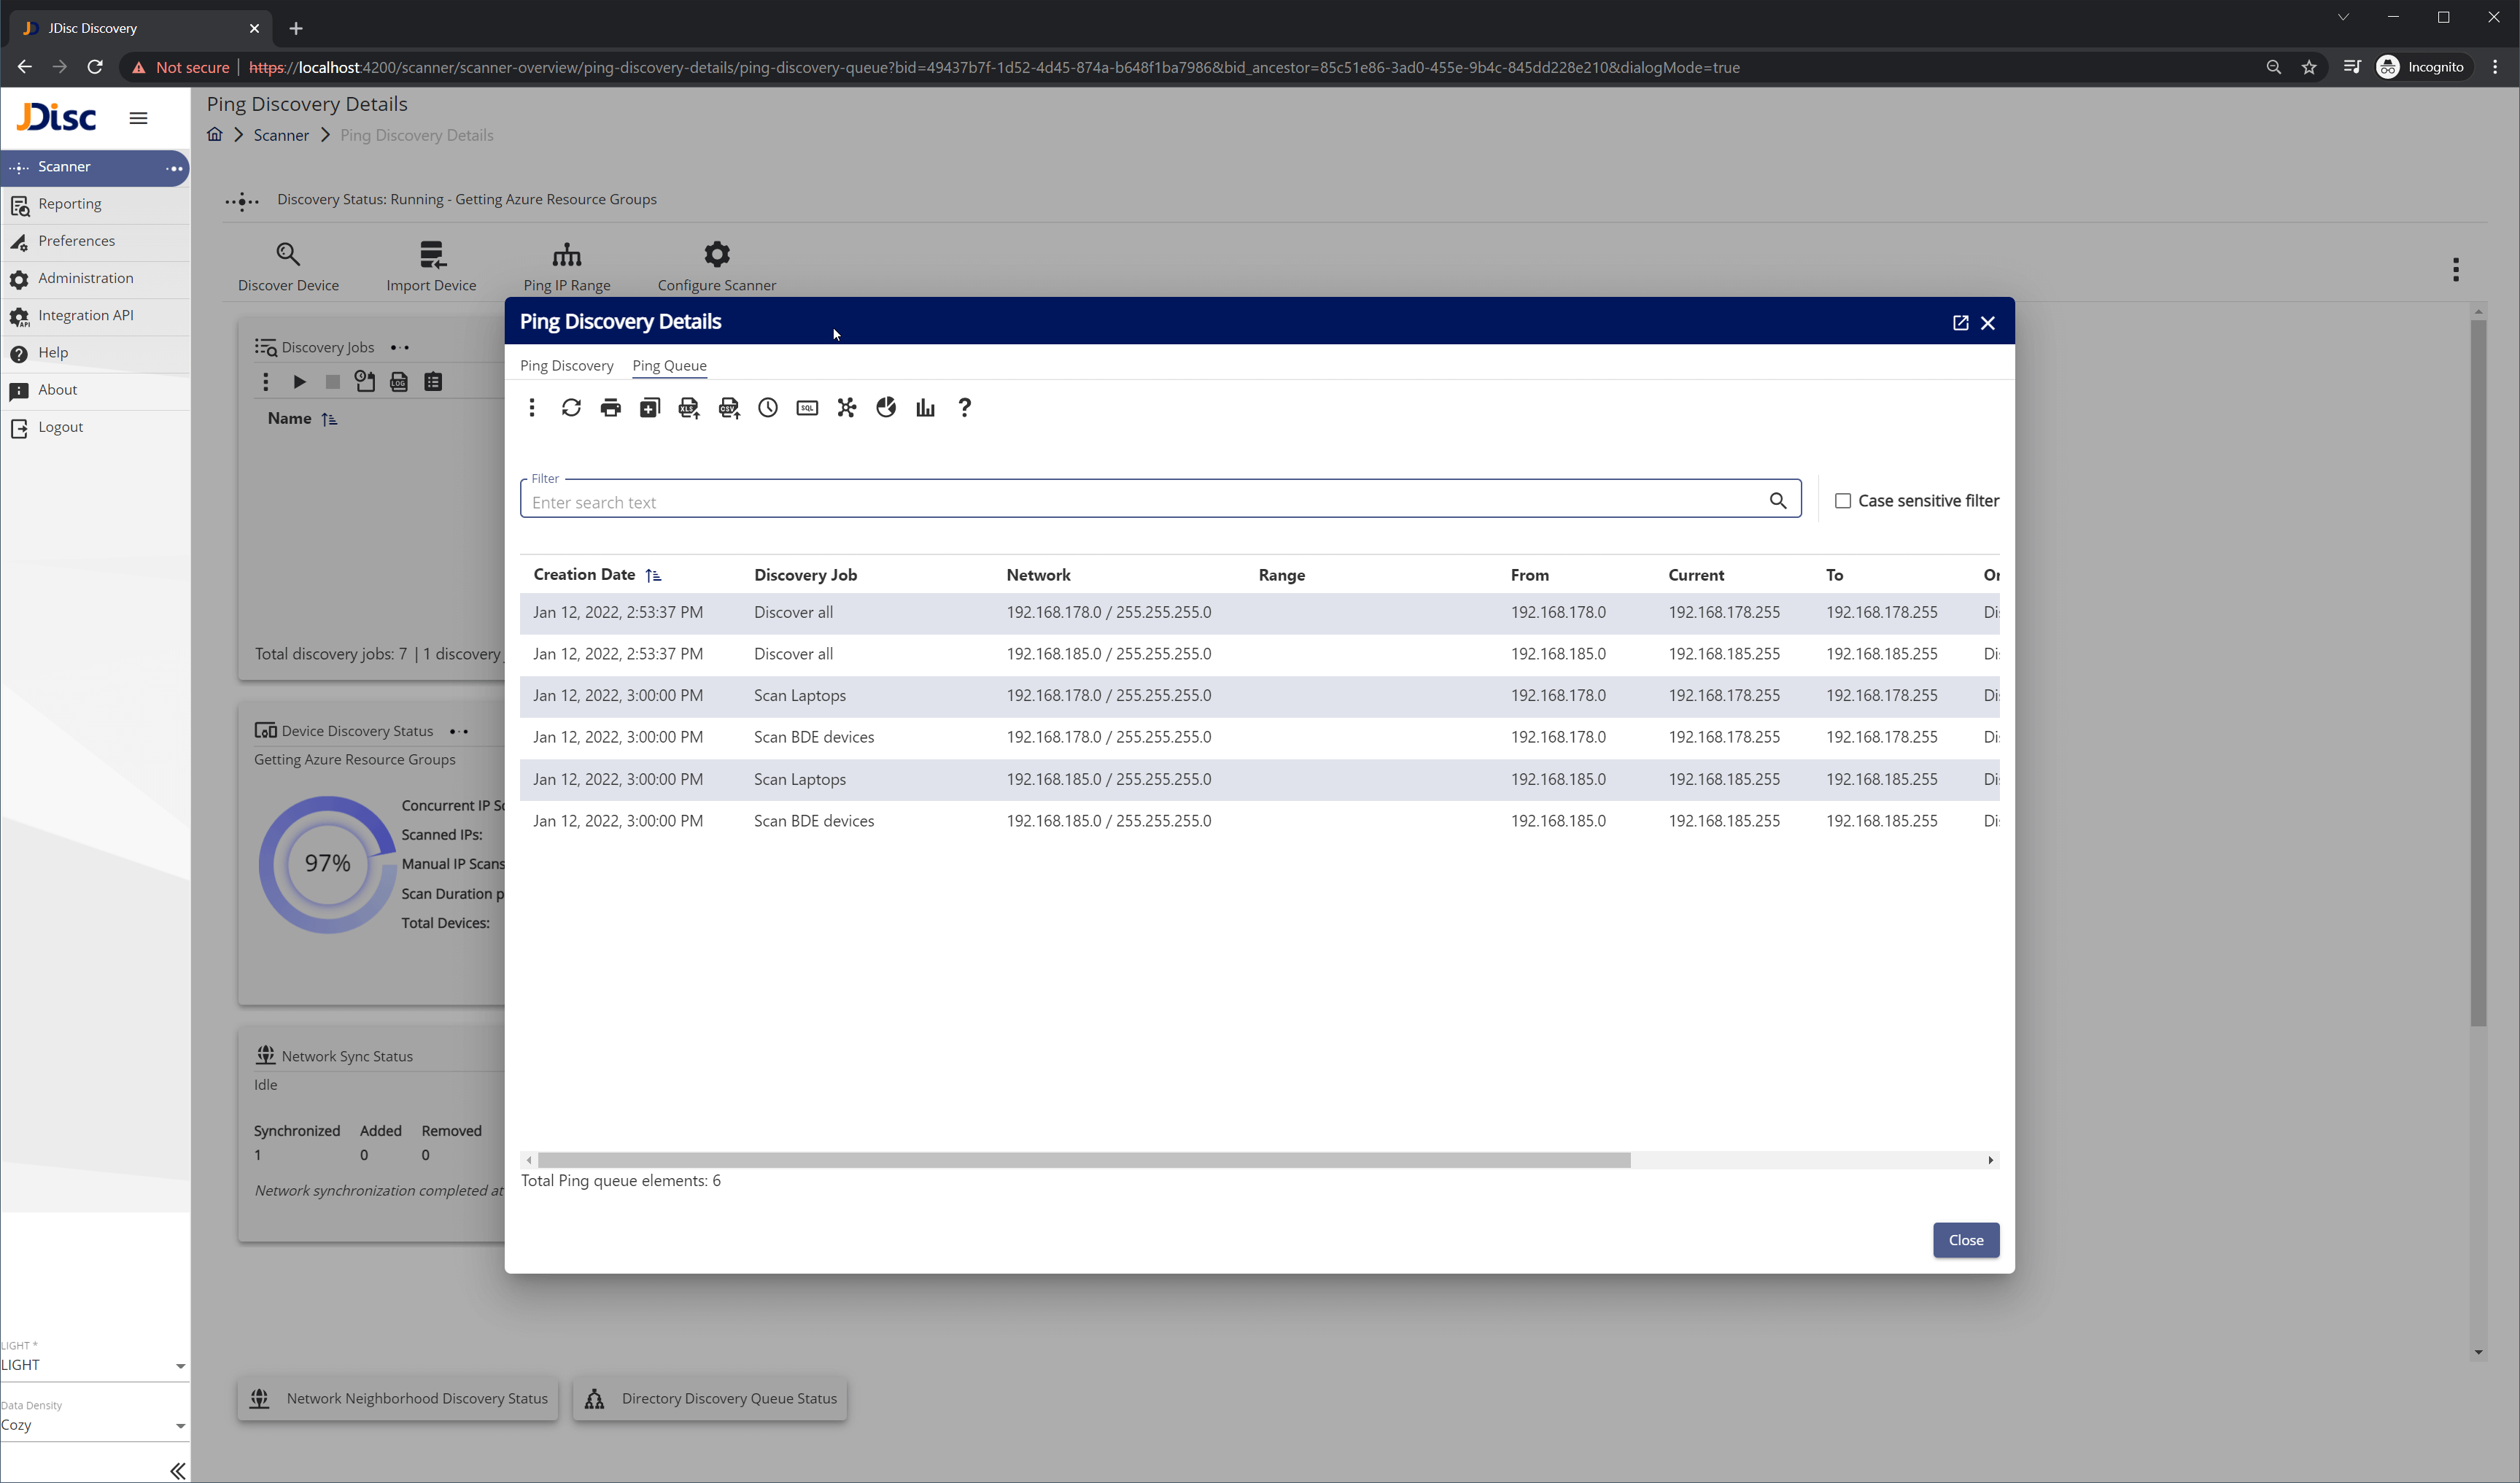
The scanner dashboard is designed to give you an overview of the discovery process. At the same time, it acts as a starting point for deep dives on details. Several dashboard items provide detail views. For instance, in the device discovery status details you can find the actual progress of each device IP that is being discovered and the device discovery queue (Figure 5.1). Likewise, you can drill down to ping discovery status details (Figure 5.2), network neighborhood discovery status details and directory discovery status details. In future releases, additional detailed views will be added.

Figure-5.1-2 Device discovery queue details
Figure 5.1 – Device discovery queue details
Figure-5.2-2 Ping discovery queue details
Figure 5.2 – Ping discovery queue details

Next Stop

We will continue to work on the scanner component, introducing scanner configuration features, more control actions like stopping a specific device discovery, more detailed views, etc. If you would like to give it a try, just download JDisc Discovery 5.0.

Are you already missing a feature that you would want to see in one of the next releases or you would like to suggest something new? We are always looking forward to getting your feedback and ideas. Please share them in our Slack channel or just drop us an email.

Stay tuned for more exciting new features.

Cheers,
Sotiris

author avatar
Sotiris Zdragkas

Leave A Comment


Der Zeitraum für die reCAPTCHA-Überprüfung ist abgelaufen. Bitte laden Sie die Seite neu.

JDisc Discovery Web UI: Scanner new features & updates

Scanner_featured

Dear JDisc friends,

It has been a long time since the last update on the progress of our new JDisc Discovery Web UI. However, this does not mean that we paused working on it. On the contrary, you may have already noticed – if you are following our release notes or if you are subscribed to our newsletter – that during the past weeks, we intensified our Web UI development and delivered a number of new features and UI improvements. As always, the features are delivered continuously within our weekly or bi-weekly software releases.

Let’s have a look at the new features.

1. Feature Discover Device

Sometimes you just need to trigger a scan for specific IPs or Hostnames. Right on the Scanner action menu, find and select the Discover Device menu item. (Figure 1.1)

An input dialog (Figure 1.2) will appear which allows you to enter in a convenient way all these IPs or Hostnames that you would like to scan. When you are done with the input, just hit Ok. A new dialog will pop-up (Figure 1.3) which will show you the device discovery status of those IPs or Hostnames that you have entered.

Figure-1.1-3 Discover Device action menu item
Figure 1.1 – Discover Device action menu item
Figure-1.2-2 Discover Device input
Figure 1.2 – Discover Device input
Figure-1.3-2 Device Discovery Details
Figure 1.3 – Device Discovery Details

2. Feature Discovery Job controls

This feature allows you to start or stop one or more discovery jobs. In order to do so, just select the job(s) and select the preferred action from the toolbar (Figure 2.1) or from the context menu (Figure 2.3). You can also start or stop all jobs (Figure 2.2).

Figure-2.1-1 Discovery Job toolbar menu
Figure 2.1 – Discovery Job toolbar menu
Figure-2.2-1 Discovery Job bulk actions
Figure 2.2 – Discovery Job bulk actions
Figure-2.3-1 Discovery Job context menu
Figure 2.3 – Discovery Job context menu

3. Feature View Discovery Job details

The following feature set is centered around the discovery job configuration and troubleshooting. For now, all features are read-only. However, in the near future, we will allow also editing.

3.1 Discovery Job list-detail view, general info & statistics

By double-clicking on a discovery job or by selecting the discovery job details icon button from the toolbar, the job details dialog opens (Figure 3.1). On the left side of the dialog, you can see all discovery jobs configured on your environment. You can easily navigate from one job to another by clicking on it. In the same dialog, you can see basic configuration attributes of the selected discovery job, as well as some statistics about the run duration of the last 30 discovery job runs.

Figure-3.1-1 Discovery job details dialog
Figure 3.1 – Discovery job details dialog

3.2 Discovery Job discovery settings & schedule

From the discovery job details dialog, you can navigate to the discovery settings tab (Figure 3.2.1) or to the discovery schedule tab (Figure 3.2.2). The schedule tab includes a calendar view (Figure 3.2.3), where the discovery job past runs (light grey), schedules runs (blue) and blackout periods (black) are visualized.

For the moment, all information is read-only.

Figure-3.2.1-1 Discovery settings
Figure 3.2.1 – Discovery settings
Figure-3.2.2-1 Schedule settings
Figure 3.2.2 – Schedule settings
Figure-3.2.3-1 Schedule calendar view
Figure 3.2.3 – Schedule calendar view

3.3 Discovery Job events

From the discovery job details dialog, you can navigate to the discovery events summary tab (Figure 3.3.1) or to the discovery all events tab (Figure 3.3.2), in order to get an overview of what type of events the discovery job generates, and – if necessary – list all of them. This view is used frequently during troubleshooting.

Figure-3.3.1-1 Events summary
Figure 3.3.1 – Events summary
Figure-3.3.2-1 All events
Figure 3.3.2 – All events

3.4 Discovery Job logs

From the discovery job details dialog, you can navigate to the discovery logs tab (Figure 3.4). There are various types of logs. This view is also used frequently during troubleshooting.

Figure-3.4-1 Discovery job logs
Figure 3.4 – Discovery job logs

4. Feature Scanner dashboard items – Full screen view

Depending on the work that you need to accomplish, you might be navigating around the various dashboard items, looking for something specific or troubleshooting. In order to make this journey convenient, we have implemented the dialog views. However, in certain cases, you might me interested in something very specific – for example the device discovery progress details (Figure 4.1). For these cases, we have implemented the full screen views. You can navigate to these views (Figure 4.2) by clicking on the expand icon on the top right corner of dialogs or dashboard items (when available).

Figure-4.1-1 Device Discovery details dialog view
Figure 4.1 – Device Discovery details dialog view
Figure-4.2-1 Device Discovery details full screen view
Figure 4.2 – Device Discovery details full screen view

5. Feature Scanner dashboard item details

The scanner dashboard is designed to give you an overview of the discovery process. At the same time, it acts as a starting point for deep dives on details. Several dashboard items provide detail views. For instance, in the device discovery status details you can find the actual progress of each device IP that is being discovered and the device discovery queue (Figure 5.1). Likewise, you can drill down to ping discovery status details (Figure 5.2), network neighborhood discovery status details and directory discovery status details. In future releases, additional detailed views will be added.

Figure-5.1-2 Device discovery queue details
Figure 5.1 – Device discovery queue details
Figure-5.2-2 Ping discovery queue details
Figure 5.2 – Ping discovery queue details

Next Stop

We will continue to work on the scanner component, introducing scanner configuration features, more control actions like stopping a specific device discovery, more detailed views, etc. If you would like to give it a try, just download JDisc Discovery 5.0.

Are you already missing a feature that you would want to see in one of the next releases or you would like to suggest something new? We are always looking forward to getting your feedback and ideas. Please share them in our Slack channel or just drop us an email.

Stay tuned for more exciting new features.

Cheers,
Sotiris
author avatar
Sotiris Zdragkas

Leave A Comment


Der Zeitraum für die reCAPTCHA-Überprüfung ist abgelaufen. Bitte laden Sie die Seite neu.