Web UI – JDisc Diagrams – Follow up

Dear JDisc friends,
as you already know, with JDisc Discovery release 5199, we have introduced a new set of features in our Web UI to support diagrams. In addition to the classic built-in reports, diagrams offer a new way to view and navigate JDisc Discovery data.
The core concept of our diagrams is to represent the various entities within the discovered data as nodes, connected by edges that illustrate the relationships between them. Fetched relationships of entity nodes are user-controlled, while various actions are offered, depending on the entity type. This approach allows diagrams to provide a comprehensive view of specific parts of our customers’ network, and makes them a very powerful tool for our users. This is why we continue to enhance and expand diagram features.
Today, we would like to share some of our recent improvements:
Diagram persistence
Our application now has the ability to remember created diagrams. This powerful feature allows users to create and easily access pre-made diagrams that show information they are frequently interested in. They may even just save a diagram and revisit it later to continue their work.
A diagram is initiated through a diagram supporting report, selecting a respective context menu option. Diagrams are always opened to a new dialog window, where the user may navigate, see entity details or further interact, affecting possibly the expansion of the diagram. Now, when reached a desired point, the user can save the diagram, either for private or global usage, and launch it again later and in the future.
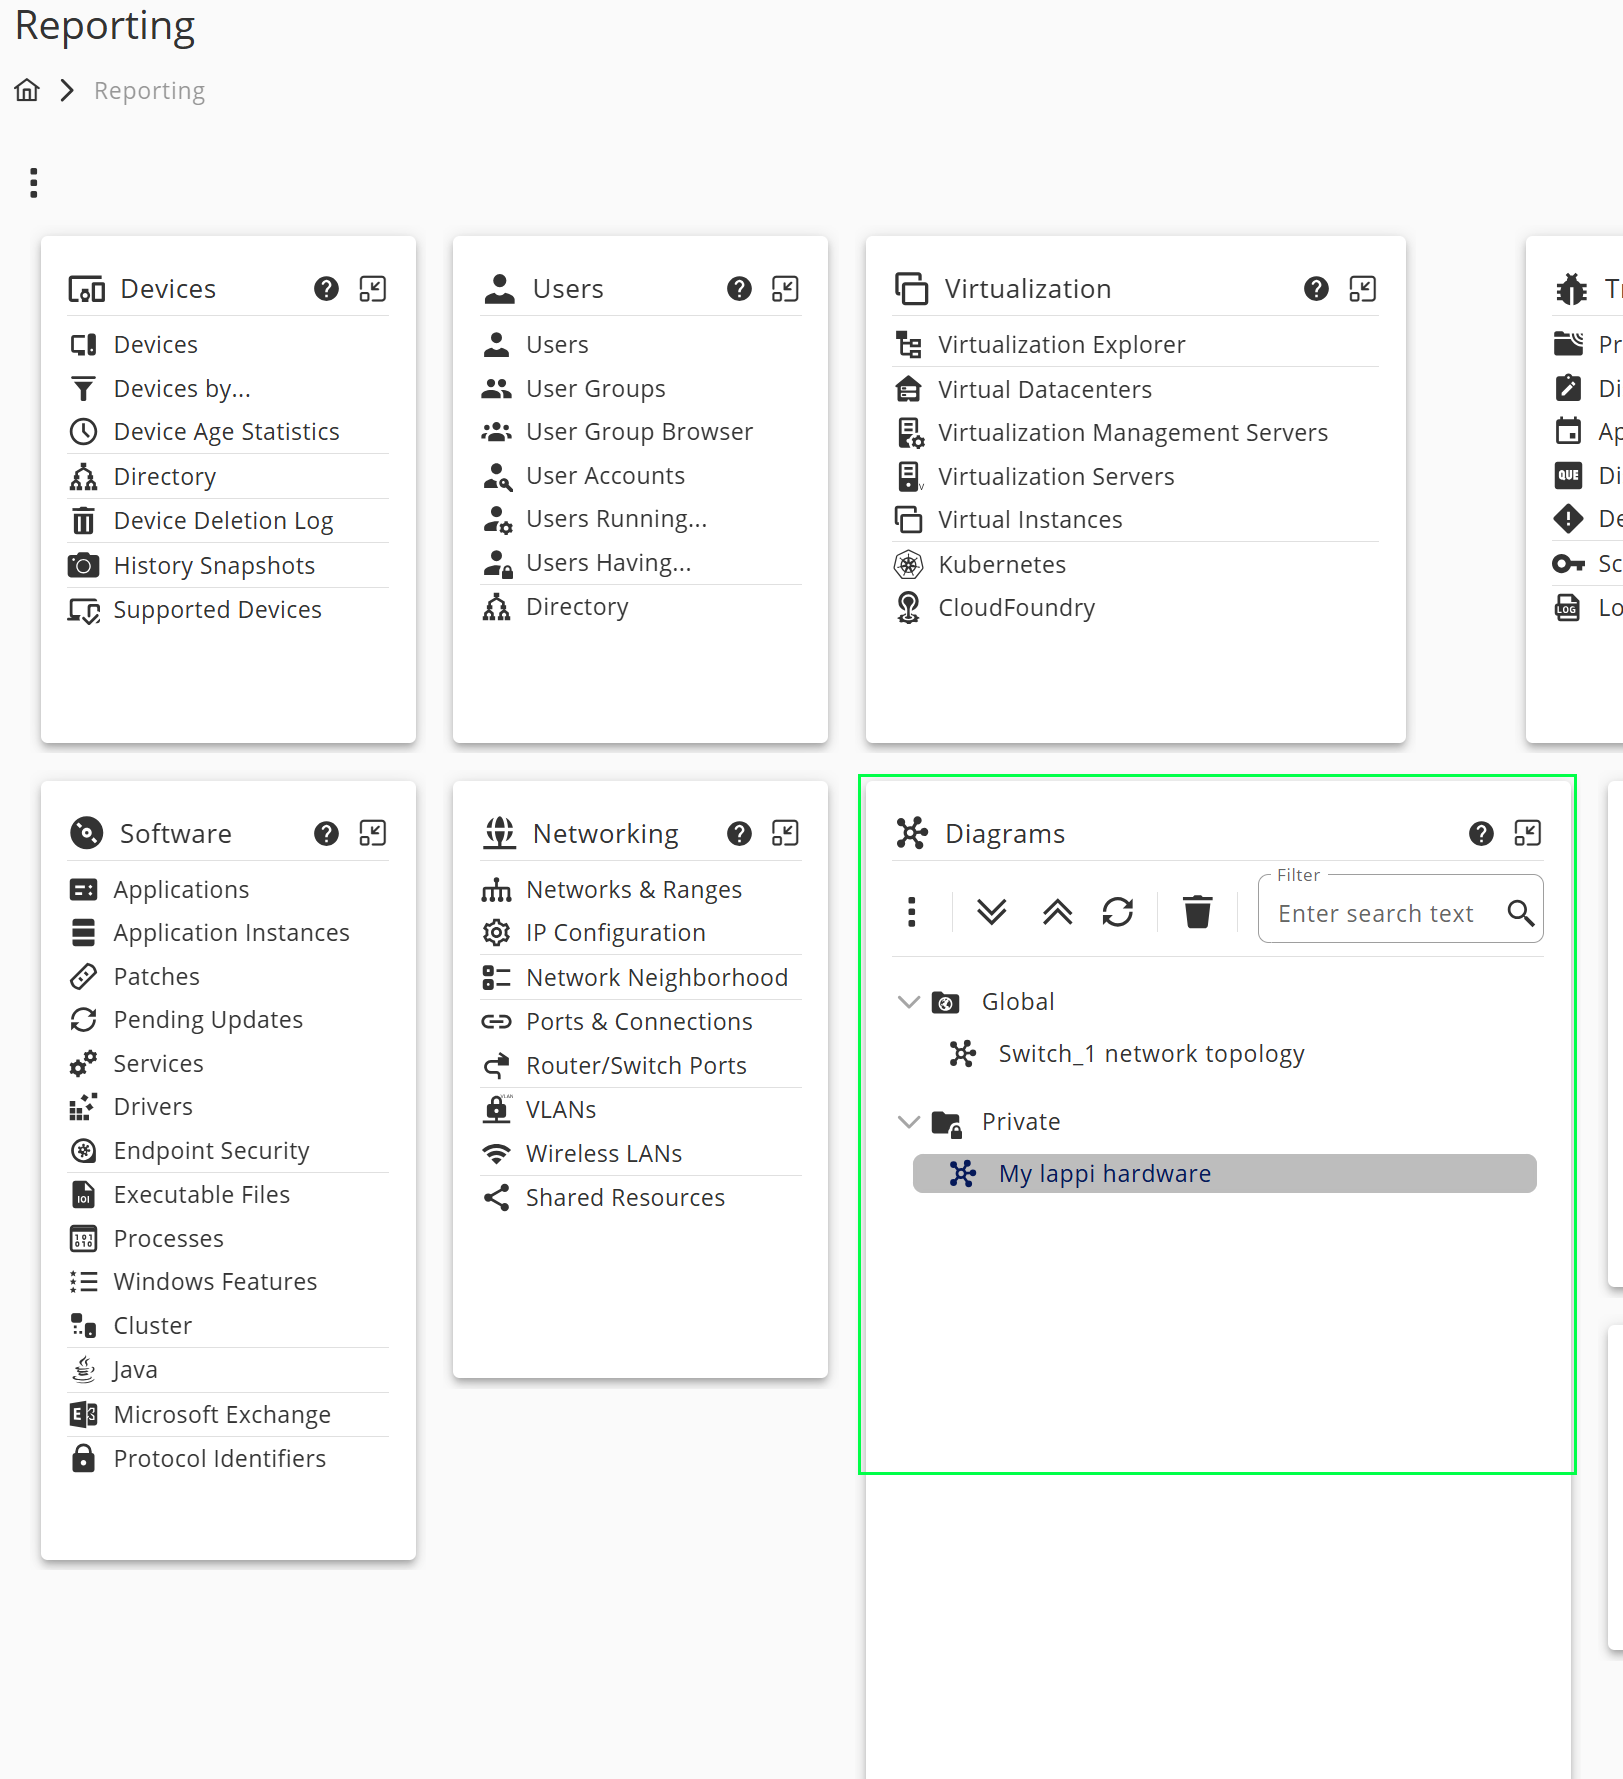
Saved diagrams can be opened through a new dashboard item, which is added to the reporting section of our application. The dashboard provides further options like rename, duplicate or delete a saved diagram.

When a saved diagram is opened, the user can make further modifications and save again or discard. Each saved diagram retains its own preferences, which are always saved along. So, instant changes to preferences can also be made as needed.
Collapsing features
We added collapsing features to improve the readability of large diagrams. It is quite common that JDisc customers have large networks containing numerous devices and other entities. Diagrams in those cases might end up containing a very large amount of nodes and edges, which is hard to navigate and work on. For such cases, we introduced the ability to aggregate sets of nodes into one group node.
The user can now make a multi selection of entity nodes and aggregate them, or he can choose to aggregate all related to a specific entity nodes. The group node’s size and caption indicates the count of included nodes, while dotted edges summarize all their relations to the rest diagram entities.

At any time we may select to ungroup an aggregation node, the included nodes will again take their initial positions on the diagram. Naturally, node aggregations are also saved when a diagram is saved.
Enhanced diagram preferences
Diagram preferences are now found on the Preferences section of our application. There, you may now configure them globally, so that each new diagram will be created according to them. However, the diagram window still contains a preferences menu option, which allows the user to instantly adjust and apply some of the preferences to the current diagram. Those adjusted preferences are saved along when we save the opened diagram.
Moreover, an aggregation preferences tab is added to diagram preferences page, containing options regarding the new aggregation feature, like the minimum count of nodes that can be aggregated.
You can also take a look at our new video, which provides a short presentation of the above features. We hope you enjoy it!
Future improvements are yet to come. We are always looking forward to getting your feedback and ideas. Just drop us an email or a comment below.
Cheers,
Fotini
